The Coming Two-Stage Silver Price Rally
Commodities / Gold and Silver 2014 Jul 04, 2014 - 11:51 AM GMTBy: Steve_St_Angelo
 As the MSM, Wall Street and various so-called analysts waste time focusing on worthless and insignificant data, the price of silver is positioning itself for the coming TWO-STAGE RALLY. The majority of the precious metals analysts discuss the revaluation of silver as it pertains to the amount of fiat currency in the system.
While this is a good determination (from past historical guidelines), it only deals with one part of the overall equation. The second and maybe the more important factor... is the destruction of "PAPER CLAIM CHECKS" on physical assets.
Chris Martenson discusses this in his excellent video "Accelerated Crash Course." When the stock and bond markets finally fall into a tailspin and the investing public realizes that it's holding onto worthless paper claims on physical assets... there will be a rush in gold and silver to protect wealth.
Over the past several thousand years, countries experienced huge devaluations of their currencies. However, economic growth and progress continued as civilization was able to tap into new lands and new sources of energy.
Today, we have reached the limitations of energy, resources and the environment. Unfortunately, MSM and Wall Street tend to ignore energy and resource scarcity in their news releases and forecasts. Why? Because without unlimited growth forever, Wall Street's business model implodes. So why even mention it?
Folks... PEAK RESOURCES destroys the ability for Wall Street to continue.
For some strange reason most people don't realize that PEAK OIL will hurt the largest entities and corporations the most. We must remember, companies such as Wal-Mart make tiny profits on huge sales.
Just imagine the amount of energy it takes to cool and heat one Super Wal-Mart store throughout the year? Think about the entire inventory and how it's manufactured, packaged, shipped, stocked on shelves and sold to the public. The amount of energy consumed in this process is staggering to say the least.
The Wal-Mart business model was based on not only cheap energy... but one with a high EROI- Energy Returned On Invested. Unfortunately, cheap energy is now replaced by very expensive oil and the EROI of U.S. and global oil production continues to decline.
When Sam Walton opened his first Wal-Mart in 1962, the EROI - Energy Returned On Invested of U.S. domestic oil production was 30/1. Thus, the U.S. produced 30 barrels oil for the market for every barrel consumed in the exploration-development-production process.
Today, the EROI is approximately 10/1 and Shale Oil is half of that at 5/1.
Which means, U.S. shale oil production provides 25 barrels less (one sixth) in net barrels of oil than the industry standard in the 1960-1970 period. This decline in NET BARRELS OF OIL forced the Central Banks and large financial institutions to produce more CLAIM CHECKS than physical assets to back them... matter-a-fact, the leverage is tremendous.
STAGE ONE: Currency Devaluation
The first stage of the two-stage price rally will be the devaluation of the U.S. Dollar and fiat currencies. It is impossible to know the exact date of the U.S. Dollar devaluation, but its coming. Some analysts do not believe that MONEY NEED TO BE TANGIBLE.... I disagree. One such analyst is Martin Armstrong. Martin stated this in one of his blog posts last year:
At the risk that the Gold bugs will assassinate me before the Politicians, MONEY is no longer tangible and in fact it has rarely been so throughout history. Consequently, money is simply whatever people accept and that means it is no different than a share in a corporation. This being the case, money is now electronic, with a tiny portion even paper.
This theory that MONEY must be tangible destroys all freedom. It is nonsense. You hedge government with your assets. MONEY is not a store of value for it rises and falls in purchasing power with the booms and busts. Just because precious metals were used as coins at various times, does not support this idea that money must be tangible. That ranks up there with the world is also flat. Everyone who has ever eaten broccoli has eventually died. Therefore, we must also assume that broccoli will kill you.
There have been hundreds of yearly intervals where money was NEVER precious metals and what about Asia where China never issued precious metal coins. They proved money is simply what everyone agrees to have value. St. Patrick wrote how the Irish used slave girls – not precious metals.
While Martin may be correct that gold and silver were not used as money for certain intervals in the past that was probably due to GRESHAM'S LAW - Bad money drives out good. However, the notion that China never issued or used precious metals as currency is blatantly false. Martin gets an "F" on this call.
According to history of the Chinese Sycee:
Silver in ancient China was very rare and precious due to the lack of rich domestic mines. Silver deposits usually were found in the same ore bodies as minerals such as quartz, lead, and antimony, and the technology for refining and purifying silver was not mastered until the Tang Dynasty, a much later date than that for copper.
It is also recorded that during the Western Han Dynasty(202 BC-5 AD), Wu T'i had issued a series of 3 kinds of silver currency, and Wang Mang of the Hsin Dynasty (8-23 AD) had also issued 2 varieties of silver currency, but both efforts completely failed.
Even though the ancient Chinese silver currencies failed... they were indeed ISSUED SILVER CURRENCIES. Furthermore, the ancient Chinese used iron and copper coins as a medium of exchange because they were able to produce these in much higher numbers as the annual production of silver was quite low.
For example, during the Chinese Tang Dynasty (618-907: Wikipedia), the annual silver production was approximately 25,000 teals. One teal equals 1.21 oz. Thus, 25,000 teals of silver production, equaled 30,250 oz per year. This is an insignificant figure when we compare it to the production of silver in Ancient Greece from 600-300 B.C., which was estimated to be 250 million oz.... 80-100,000 ounces per year (U.S. Bureau of Mines-Summarized Production of Silver).
During the time (600-300 B.C.) when the Ancient Greeks were producing silver from their massive deposits outside the Laurium region in Greece, the population was approximately 8-10 million. They produced enough silver to supply each Greek citizen with 15-25 silver coins (1 oz each). This is just an estimation.
Now compare that to the Chinese Tang Dynasty, nearly one thousand years later, that only produced 30,000 ounces of silver annually at a total of about 9 million ounces over the 300 year period (618-907) for a population of 50-80 million (Wikipedia).
Here we can see, that silver was too rare to be used as a form of currency for the typical Chinese. However, later on, as technological improvements in mining and smelting advanced, China produced a great deal more silver and its importance grew as a currency and medium of exchange.
According to the History of the Chinese Sycee:
During the Sung Dynasty domestic silver production increased significantly. In the Northern Sung, the annual national silver production varied from 210,000 to 880,000 teals (#1). This increased supply of silver is confirmed by records...
Using silver as currency, then, became an alternative. As some goods became priced in silver, many silver shops were opened in the capital. Currency exchange, sycee casting, and assaying became general practice.
Silver's importance as currency increased significantly in the early Yuan Dynasty (Mongolian Empire: 1206-1271, Yuan Dynasty: 1271-1368). The new Mongolian rulers brought with them the concept that silver should be one of the major currencies of the empire. Silver was treated as legal tender, and a connection between it and other currencies was developed.
Martin Armstrong might get around the truth by stating that the Chinese never issued "Official Silver Coins", but they did use silver as trade and currency for over a thousand years. And during the periods when Chinese rulers decided to use paper currencies, it didn't take long for silver to return as REAL MONEY for the Chinese.
Again, from the History of the Chinese Sycee:
When the empire decided to adopt the paper note policy of its former enemies- the Southern Sung and Jin – the circulation of silver began to be restricted or even banned.
However, this temporary setback did not cause silver to lose its attraction; the unlimited issuance of paper notes by the empire created serious inflation, and as a result, through the remainder of the Mongol Empire, silver was used by people secretly and privately instead of the devalued paper money. People never gave up using silver, since the paper money was debased, and they even resort to barter rather than using paper notes. This situation lasted for several decades until the silver ban was abolished by emperor Yin Zhong (1435-1450, 1457-1464). Silver was once again widely circulated in China, and almost all the surviving Ming silver ingots date from that time.
According to a historical record, official's of late Ming period received their salaries 10% in cash coins and 90% in silver, and all levels of Chinese people conducted transactions using silver.
So, there we have it. Even though the typical Chinese were forced to use paper currencies for periods of time in the past, they never gave up faith in silver as real tangible money for trade.
This is the same predicament we are in today. The U.S. Dollar is a pure fiat currency and has been for over four decades. While Americans continue to use it as legal tender, its value has eroded tremendously. Currently, we are witnessing several high-profile countries such as China and Russia create trade deals around the U.S. Dollar. In time, this will become a torrent.
We must remember, HYPERINFLATION is a currency event. When the faith in paper currencies erodes, the value of it implodes. Thus, money velocity goes into hyper-drive as the public tries to purchase physical goods and services as the value of the currency continues to decline -- hyperinflate..
This will be ONE STAGE of the revaluation of silver - physical silver. The next will be the time when investors move out of increasingly worthless PAPER CLAIM CHECKS and into real physical assets to protect their wealth.
STAGE TWO: Out of Paper Claim Checks & Into Physical Silver
As I mentioned in the earlier part of the article, Chris Martenson put together a great video on Accelerated Crash Course where he discusses how there are so many paper claims against physical assets. I highly recommend watching the video if you haven't seen it already.
You see, as the global energy supply grows, paper claims can continue to increase as there will be more energy next year to pay the annual interest or payment. However, when the oil supply peaks... then we run into BIG TROUBLE. This is the reason I include ENERGY DATA in my articles.
While I realize that most precious metal investors focus only on their GOLD & SILVER investments... energy will play a key role in how things unfold in the future.
Martin Armstrong is a very smart individual and has a huge following due his excellent ability in PUSHING THE RIGHT BUTTONS. And the right buttons are the Communist-Socialist Bogeymen. According to Martin, the problems of our society stem mostly from the politicians, communists and socialists.
While I agree that politicians and "Ism's" don't really solve the problems of humanity, I find it simply amazing that we never hear Mr. Armstrong speak of PEAK OIL... or the CLIMATE for that matter. ZIP.... NADA... ZILCH.
This is my biggest disagreement with Martin. Martin provides some great cycle charts and graphs on all phases of social and economic life, but where is his PEAK OIL CHARTS??? How do we get around that one?
I don't mean to pick on Martin, however he falls victim to the same kind of ideology that one 'ISM" (capitalism) is better than another. Folks... PEAK OIL will destroy all "ISMs." Capitalism won't survive peak oil either.
Let's take a look at one example of the energy sector that Martin fails to recognize -- U.S. Shale Gas Production. U.S. natural gas production peaked in 1973 at 21.7 Tcf (trillion cubic feet) and continued to decline (or stay flat) until the miracle of shale gas supposedly saved us.
Even though U.S. shale gas production increased considerably over the past several years, without the growth from just two fields... overall production would be declining. First, let's look at the EIA - U.S. Energy Information Agencies chart of U.S. total shale gas production:
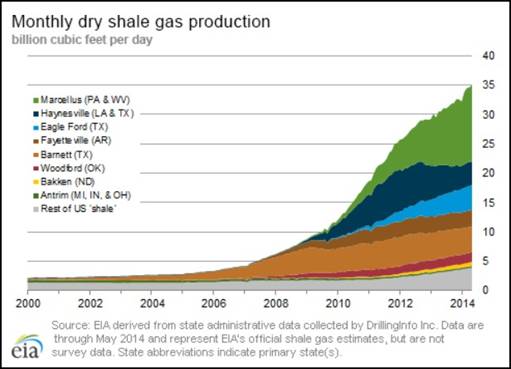
Currently, U.S. shale gas production is 35 Bcf/d (billion cubic feet per day). At this rate, it would equal 12.7 Tcf for the year (35 Bcf/d X 365 days). The Marcellus, shown in the green portion of the chart, is the one major reason total U.S. natural gas production is still increasing.
If we were to exclude the Marcellus and Eagle Ford shale gas fields from the chart above, this would be the result:
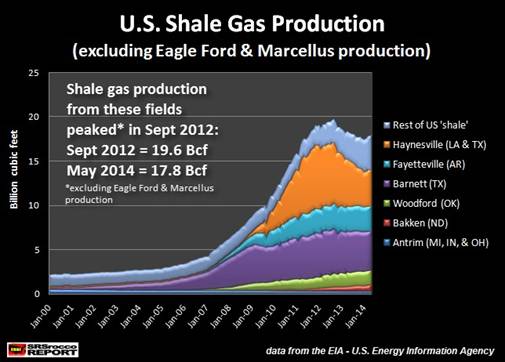
According to the EIA's data, shale gas production from all other fields (minus Eagle Ford & Marcellus) peaked in Sept. 2012 at 19.6 Bcf/d and is now down to 17.8 Bcf/d. Most of the declines are from the Barnett (purple) and Haynesville (orange).
To understand the rapid almost exponential growth of the Eagle Ford and Marcellus shale gas, we need to look at the next chart:
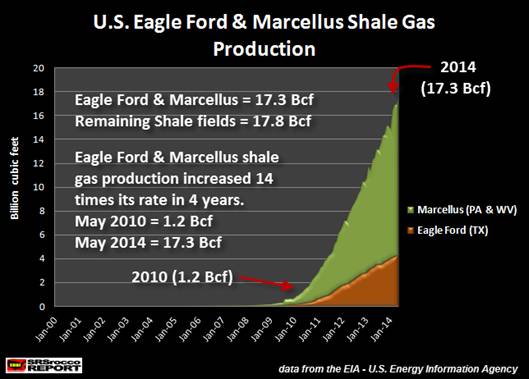
The Eagle Ford is shown in brown and the Marcellus, in green. In May of 2010, production of both fields totaled 1.2 Bcf/d. However, in just four years, production from the Eagle Ford and Marcellus increased 14 times to a staggering 17.3 Bcf/d.
While this is impressive... IS IT SUSTAINABLE?? We must remember, any chart or graph that increases in this fashion, normally declines in the same way. If you look at the chart above showing the Haynesville (in orange), its production increased rapidly, and so did its decline.
Here's an interesting comparison. Let's look at total U.S. natural gas production going back to 1930. In 1940, the United States produced 2.6 Tcf (trillion cubic feet) of natural gas and by 1973, production peaked at 21.7 Tcf. Thus, it took thirty-three years for domestic gas production to increase 8 times its rate of 2.6 Tcf in 1940.
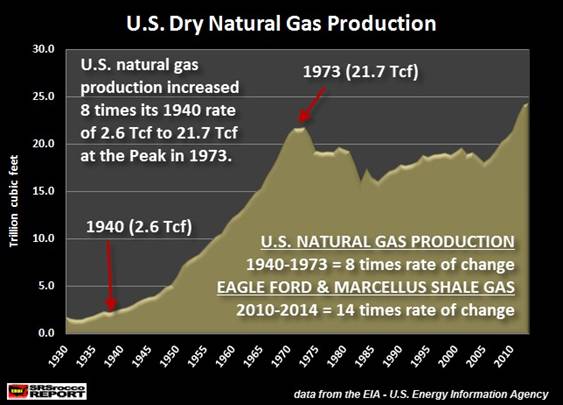
Now, the Eagle Ford and Marcellus totally blew away that historical record by increasing production 14 times the rate in just four years. I don't want to get into too many numbers, but here are the results:
Eagle Ford & Marcellus Field Total Production
May 2010 = 1.2 Bcf/d X 365 days = 0.5 Tcf (for entire year)
May 2014 = 17.3 Bcf/d X 365 days = 6.3 Tcf (for entire year)
For the Eagle Ford and Marcellus to continue this same rate for 33 years, total production would reach approximately 50 Tcf by 2047. Again... that's from just these two fields increasing at current rates of production. I doubt production will increase past 2020.
Energy analyst, Bill Powers believes the Marcellus shale gas field may peak by next year, or the year after. We will see. The important take-away here is that the growth of U.S. natural gas production comes at the mercy of just two fields.
As U.S. Shale Oil & Gas production peaks and declines, it will put severe pressure on those Trillions of Dollars of Paper Claims. Below is one of my favorite charts showing just how insane these PAPER CLAIMS have become.
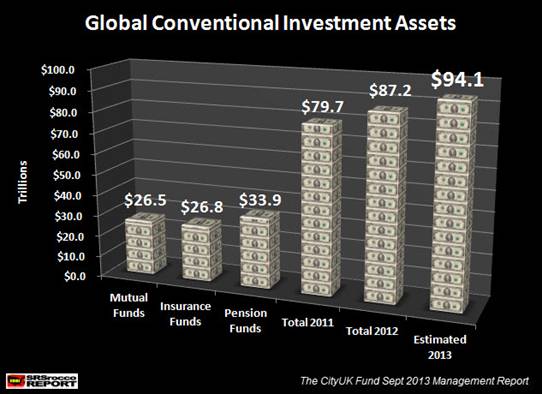
According to the recent CityUK Fund Dept 2013 Management Report, there were $94 trillion in Global Conventional Assets under management. As I stated several times, valuations of these paper assets are based on a growing global energy supply.
Unfortunately, PEAK OIL is here.... it's just a matter of time before the declines take place and we enter into a world in which we have no experience. Thus, as the energy supply declines, the valuations of STOCKS, BONDS and most PAPER ASSETS go down with it.... probably not an orderly decline.
When the investing public realizes that GROWTH IS NOT POSSIBLE... I can see a panic out of PAPER CLAIMS and into physical assets such as GOLD & SILVER coming in the future.
Lastly.... as Chris Martenson wisely states, "It's better to be a year early, than a day late."
Please check back for updates at the SRSrocco Report and you can also follow us at Twitter:
2014 Copyright Steve St .Angelo - All Rights Reserved Disclaimer: The above is a matter of opinion provided for general information purposes only and is not intended as investment advice. Information and analysis above are derived from sources and utilising methods believed to be reliable, but we cannot accept responsibility for any losses you may incur as a result of this analysis. Individuals should consult with their personal financial advisors.
© 2005-2022 http://www.MarketOracle.co.uk - The Market Oracle is a FREE Daily Financial Markets Analysis & Forecasting online publication.


