


Commodity Bull Or Bear - The Long Term Perspective
Commodities / Commodities Trading Jul 02, 2014 - 06:58 PM GMTBy: Peter_Vogal

 Many investors are uncertain whether we are in a commodity bull or bear market. Without a doubt, there are a lot of conflicting fundamentals regarding shortages and surpluses in soft commodities such as cocoa, coffee or wheat and corn. Then there are the metals such as copper, which had record high warehouse inventories only to see them draw down rapidly in a matter of months, likewise with aluminum and zinc. The only commodity that has remained positively stable for the last 5 years is crude oil. If you combine the individual commodity news with the general international consensus that deflation is the problem, it is hard to find a plausible reason to support a resumption of the commodity bull market. The only reason that comes to mind is the potential growth and demand from the new growth economies of the BRIC (Brazil-Russia-India-China) countries, but even that becomes difficult to quantify as each of those countries always seems to have their own economic problems that makes them difficult to analyze as a whole.
That lack of plausibility and uncertainty is what distills doubt in the minds of investors that allows bottoms (or tops) to be created. It is also one reason to fall back on price history charts, as the time perspective of investing is useful in discerning where we were, where we are now, and where we might go in the future – long, medium and short-term. In order to do that, we first must develop a bullish or bearish premise based on the long-term history of the asset class we want to assess.
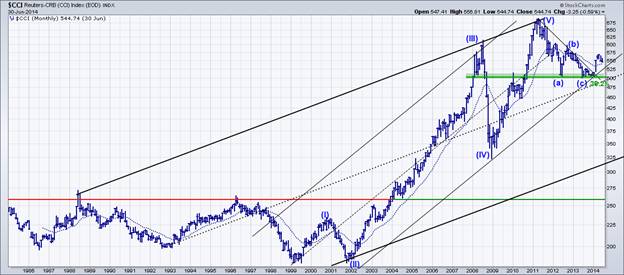
Lets look at the long-term monthly Commodity chart, with a few other commodities underlying it to see if we can see whether our long-term premise should be bullish or bearish. May will be surprised that despite the lows in commodities were made in 1999 and 2001, the predictive trend channel extends back to 1988 and this you will see as a common theme in the remainder of the charts. An important part of determining a valid trend channel is the symmetry of the bisecting centerline. You can see that the Reuters CRB-CCI Commodity Index below is in a clear uptrend on a very-long and long term basis. Not also, the clear 5-Wave count on the bull market that began in 1999 and more recently the last 3 year correction that is labeled as an a-b-c, implying that this bull market will continue. On a medium term basis, it’s price has bounced off of a 38.2% Fibonacci support level highlighted in green and measured from the 1999 lows. When using trendlines on a long-term basis, it is important to use logarithmic scaled charts for a proper undistorted view.
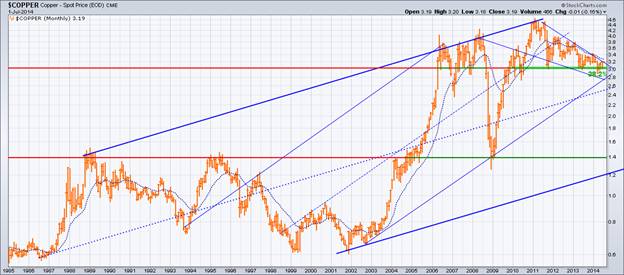
Copper is in the same bullish position having found support at the 38.2% retracement level, but has not yet broken above the medium term downtrend.
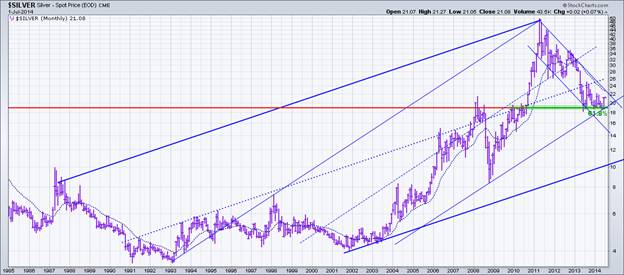
Silver is in the same bullish position having found support at the 61.8% retracement level, but has not yet broken above the medium term downtrend.
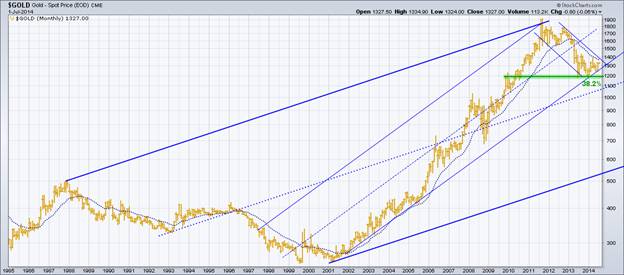
Gold is in the same bullish position having found support at the 38.2% retracement level, but has not yet broken above the medium term downtrend.
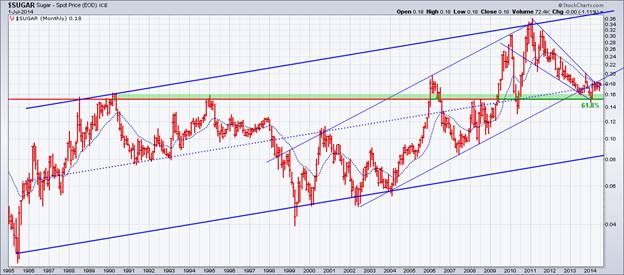
Sugar is in the same bullish position having found support at the 61.8% retracement level, and has broken above the medium term downtrend from a wedge pattern. Although the long-term uptrend line from 2002 was broken to the downside, we would place more reliance on the significant support level at $0.15 going back to 1988 combined with the recent upside break.
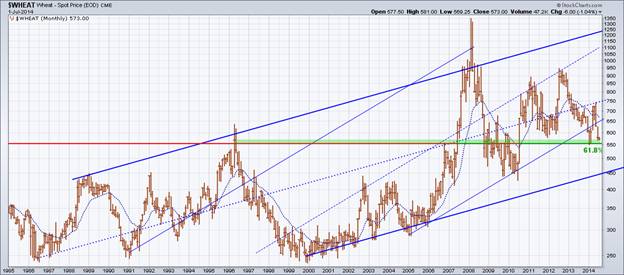
Wheat is in the same bullish position having found support at the 61.8% retracement level, however the long-term uptrend line from 2000 was broken to the downside (Corn is in a similar position). Grains may be the least bullish of the commodities, hence, it is important that the significant support retracement level holds, otherwise they could retrace to the lower more significant uptrend line.
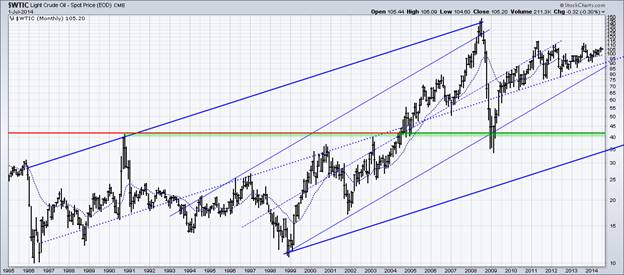
Crude Oil is also in a bullish position, but it consolidated during the last 3~4 years rather than retrace, indicating that oil has been the strongest of all the commodities.
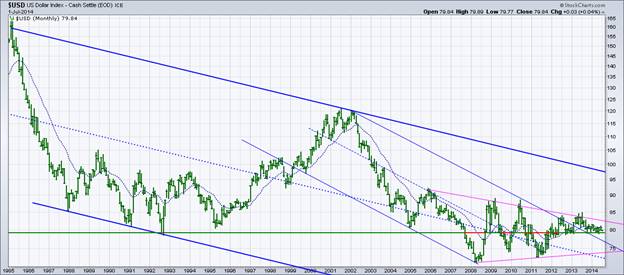
Now having looked at the Commodity price chart and a number of their underlying components, it is probable that the premise or view should be a bullish one at this time (until proven otherwise). Another plausible reason to be bullish on commodities may also be supported by the chart below of the US Dollar, which you will notice is somewhat of a mirror image of the commodities above. It looks decidedly bearish, with the exception of the 2002 downtrend line break in 2013. The horizontal support level at the 79 level is significant as it touches a low from 1992 and also appears to bisect a consolidation triangle since 2008. If the 79 level is broken to the downside, then 75 would be the next target and that would no doubt be bullish for commodities.
Keeping a proper long-term perspective is important to understanding where we are in the near term as well. In our next Part 2 – Near Term Perspective, we will show investors the shorter term prospects for the commodity index and which commodity has the greatest upside potential.
Peter Vogel
InvestorKey
email: peter.vogel@investorkey.com
website/blog: investorkey.com
Peter Vogel began his investment career in 1981, first as a Floor Trader and then as an Investment Advisor for a major securities firm. During that time he acquired several securities and options licenses and became registered as a Commodity Trading Advisor (CTA). He also co-founded a venture capital organization that helped finance and commercialize a number of new technologies. Since the beginning of his 33+ years of investing, he developed his own style of technical analysis by focusing on ratio analysis and money management techniques, creating methods that often allow him to buy near precise turning points with confidence.
Copyright © 2014 Peter Vogel - All Rights Reserved
All ideas, opinions, and/or forecasts, expressed or implied herein, are for informational purposes only and should not be construed as a recommendation to invest, trade, and/or speculate in the markets. Any investments, trades, and/or speculations made in light of the ideas, opinions, and/or forecasts, expressed or implied herein, are committed at your own risk, financial or otherwise. The information on this site has been prepared without regard to any particular investor’s investment objectives, financial situation, and needs. Accordingly, investors should not act on
© 2005-2022 http://www.MarketOracle.co.uk - The Market Oracle is a FREE Daily Financial Markets Analysis & Forecasting online publication.