


Will Overseas Stock Market Volatility Hit U.S. Shores?
Stock-Markets / Stock Markets 2014 Jul 02, 2014 - 11:59 AM GMTBy: Clif_Droke

 While the U.S. indices have been mostly upbeat, most of the action has been in Europe.
Stocks across several European exchanges were hard hit last week as investors overseas panicked over a slate of negative news – the same news, ironically, that investors in the U.S. blithely ignored. Adding to the dramatic reversal in sentiment, the European Commission reported on Friday an unexpected drop in household and business economic confidence. Economists are also concerned about the threat of deflation since the euro zone inflation rate remains stubbornly below 1%.
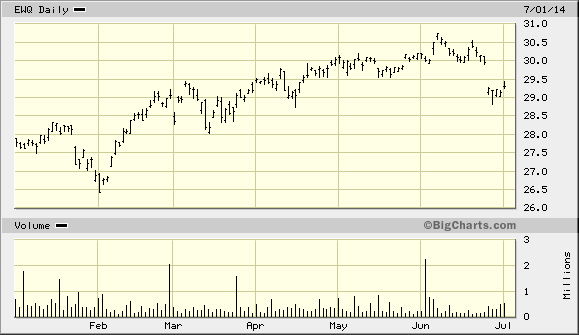
To give you an idea of the damage suffered across European bourses in the last few days, France’s CAC40 stock index declined nearly 5% below its 6-month high from early June. The following chart of the iShares MSCI France ETF (EWQ), a proxy for the France stock market, shows the extent of the damage. Banks on the continent were also under pressure as they face the prospect of additional capital-raising stock sales, according to Michael Santoli of the Daily Ticker.
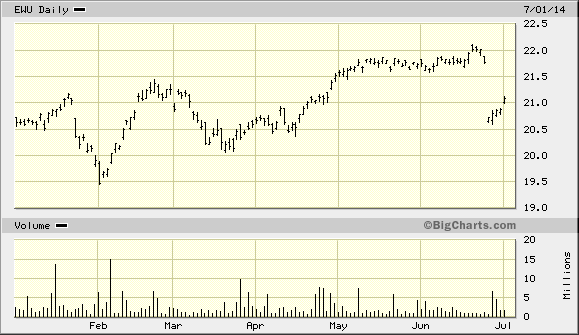
Britain’s FTSE stock market index was particularly hard hit by selling pressure recently. The iShares MSCI United Kingdom ETF (EWU), a proxy for Britain, was some 6% below its year-to-date high from just two weeks ago. The stock markets of Germany and Italy were also lower in trading last week.
In London, the Bank of England (BoE) recently identified rising house prices as a major threat to financial stability, imposing new “loan to value” limits on mortgage lenders. This is part of an ongoing concern as two chief U.K. financial-policy makers warned earlier this month of a U.K. housing bubble. BoE Governor Mark Carney called real estate “the greatest risk to the domestic economy.”
Commenting on this, the Wall Street Journal wrote: “Britain’s concerns highlight a central challenge to policy makers in the era of low interest rates: how to prick bubbles early without sapping a tremulous recovery.” The preemptive strategy for preventing the sort of real estate crash the U.S. suffered a few years ago isn’t without peril, however. Putting the brakes on lending and trying to deflate bubbles can often backfire and create panic in the investment markets, thereby creating a self-fulfilling prophecy of deflation. Such a scenario, if it unfolds, could easily put pressure on U.S. equities as investors temporarily exit risk assets and move into safe havens like gold and Treasuries. It’s important to remember that increased volatility at home sometimes begins with market turbulence abroad.
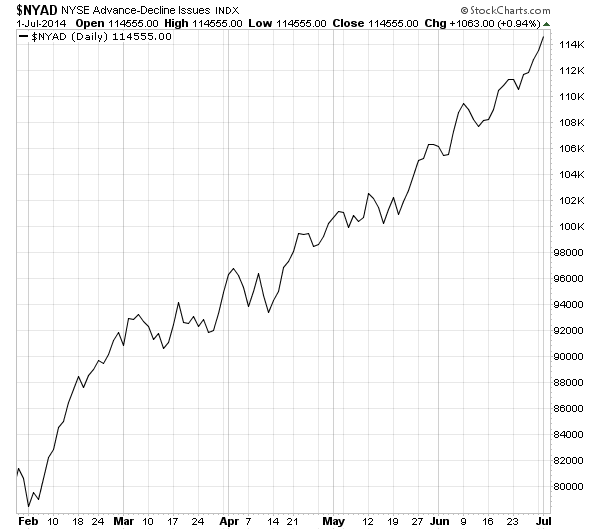
This brings us back to the short-term technical considerations for the U.S. stock market. As we look under the hood we find that most short-term technical indicators remain positive and are confirming the immediate-term uptrend. The single most important factor of the market’s immediate-term (1-3 week) health is the fact that the SPX remains above its 15-day and 30-day moving averages on a closing basis. Another important confirming indicator is the NYSE Advance-Decline (A-D) line, which as of this writing has closed at another new high.
U.S. stocks are priced to perfection right now, though, which means that it probably wouldn’t take much to cause investors to re-think their optimism. A low-volume summer trading environment such as this one works both ways: it makes it easier to push equity prices higher in the absence of negative catalysts, but it can also make it easier for bears to gain control if unexpectedly bad news appears.
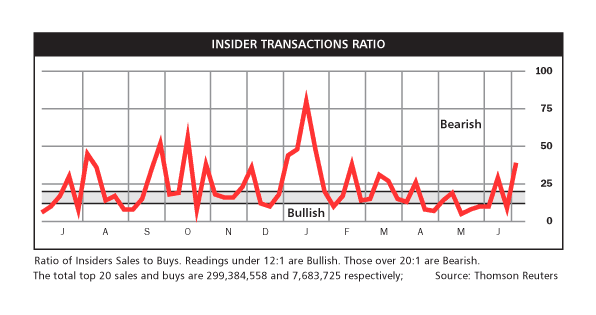
There is at least one indicator which suggests that “smart money” sentiment is diminishing. The Thomson Reuters Insider Transactions Ratio has risen to its highest level since February in the last few days. The following graph is courtesy of Barron’s and shows that insider stock purchases have been creeping higher recently. The ratio hasn’t quite reached historically bearish proportions, meaning that this rally may still have legs, but the indicator appears headed in that direction.
Pre-holiday trading tends to see diminished volume as the week progresses and the existing trend (namely sideways-to-higher) often continues based on sheer momentum. Consider also that the NYSE short-term directional indicator – which is a measure of internal momentum based on the 52-week new highs and lows – is still rising. After the Independence Day holiday on Friday, however, we’ll need to be especially alert as traders and investors returning from vacation will give the market their undivided attention. The market could be vulnerable to a volatility spike later in the month based on the mounting evidence from the sentiment indicators.
High Probability Relative Strength Trading
Traders often ask what is the single best strategy to use for selecting stocks in bull and bear markets? Hands down, the best all-around strategy is a relative strength approach. With relative strength you can be assured that you're buying (or selling, depending on the market climate) the stocks that insiders are trading in. The powerful tool of relative strength allows you to see which stocks and ETFs the"smart money" pros are buying and selling before they make their next major move.
Find out how to incorporate a relative strength strategy in your trading system in my latest book, High Probability Relative Strength Analysis. In it you'll discover the best way to identify relative strength and profit from it while avoiding the volatility that comes with other systems of stock picking. Relative strength is probably the single most important, yet widely overlooked, strategies on Wall Street. This book explains to you in easy-to-understand terms all you need to know about it. The book is now available for sale at:
http://www.clifdroke.com/books/hprstrading.html
Order today to receive your autographed copy along with a free booklet on the best strategies for momentum trading. Also receive a FREE 1-month trial subscription to the Gold & Silver Stock Report newsletter.
By Clif Droke
www.clifdroke.com
Clif Droke is the editor of the daily Gold & Silver Stock Report. Published daily since 2002, the report provides forecasts and analysis of the leading gold, silver, uranium and energy stocks from a short-term technical standpoint. He is also the author of numerous books, including 'How to Read Chart Patterns for Greater Profits.' For more information visit www.clifdroke.com
Clif Droke Archive |
© 2005-2022 http://www.MarketOracle.co.uk - The Market Oracle is a FREE Daily Financial Markets Analysis & Forecasting online publication.