Stock Market Bearish Indexes
Stock-Markets / Stock Markets 2014 Jun 30, 2014 - 12:26 PM GMTBy: Andre_Gratian
 Current Position of the Market
SPX: Very Long-term trend - The very-long-term cycles are in their down phases, and if they make their lows when expected, there will be another steep decline into late 2014. However, the Fed policy of keeping interest rates low has severely curtailed the full downward pressure potential of the 40-yr and 120-yr cycles.
Intermediate trend - The DOW may be tracing out an ending diagonal pattern.
Analysis of the short-term trend is done on a daily basis with the help of hourly charts. It is an important adjunct to the analysis of daily and weekly charts which discusses the course of longer market trends.
BEARISH INDEXES
Market Overview
The anticipated minor market top caused some strong reactions to the downside by the SPX on the 24th and 26th, but each time, instead of some follow-through of the initial weakness there were price retracements of better than 50%. This suggests that the bulls are still capable of supporting prices before too much weakness takes hold.
Some of the key leading indexes (IWM and QQQ) refused to follow the lead of the SPX and the DOW. This probably encouraged buyers to step in and the sellers to be restrained. But two key leading indices (DJIA and XLF) actually underperformed the SPX. We will analyze the DJIA in detail a little later on because it is beginning to confirm my suspicions (shared in previous letters) that it is making an ending diagonal/terminal pattern, which is a strong warning that an important top is coming sooner rather than later. It's no longer a question of "if", but a question of "when". This is why I suggested recently that we should treat each minor top as if it could turn out to be the beginning of something more severe. Even the QQQ (which made a new high) and IWM (which did not but had a good rally) are in short-term uptrends which, judging by their daily momentum oscillators, are beginning to look fragile.
Is this correction over, or (as some think) are we still in the "B" wave? That is for the market to tell us over the next week or so. I would be surprised if, by the looks of things, we could get beyond the second week in July before seeing a more important correction take hold. When you see the charts of the DJIA and the XBD compared to the SPX, you will see why I am concerned that this bull market phase is on a very short leash!
Chart Analysis
We'll start with the Dow Jones Industrials, which hardly requires an in-depth analysis to see its relative weakness to the SPX. After an initial rally from the February low when it tested its 200-MA, the DOW has looked more and more tired. Although it finally managed to make a new high, it was only by a few points. The upper trend line is at a far lesser angle than the lower one, resulting in a well-defined wedge formation. Unless DJIA has a powerful rally which alters this pattern, it is getting more and more likely that the bottom trend line will be the first to be challenged.
If this turns out to be a terminal pattern, it would be normal for prices to retrace to 15340, the start of the wedge but, considering the fact that important cycles are due to make their lows around October this could turn out to only be a pause in the downtrend.
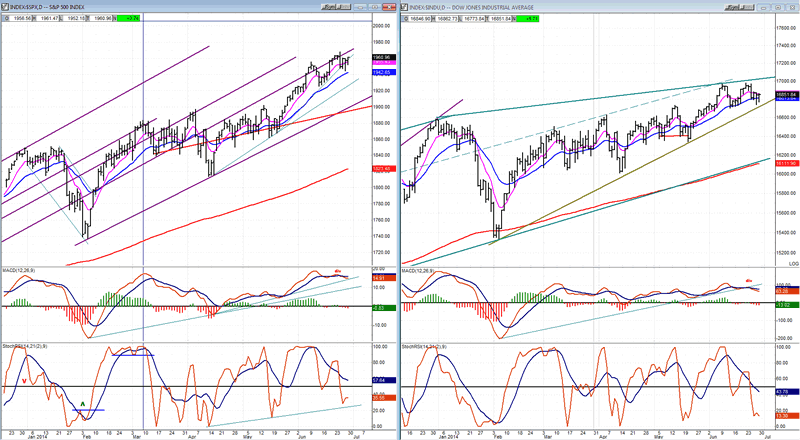
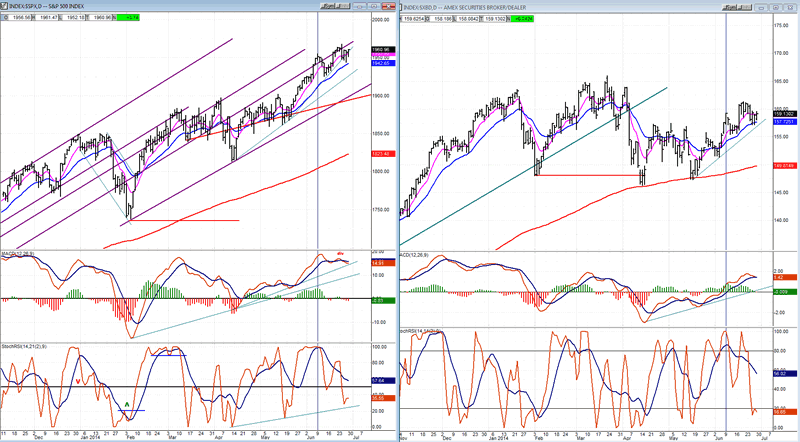
The DOW industrials are often the first to make an important market top and, therefore, the pattern that the index is making should be respected. Especially when the American Securities Broker/Dealer index (XBD, another index which is widely acknowledged as one of the best leading indicators) is giving us the same warning.
If anything, its chart (below) is even more bearish than that of the DOW. It made its final high in March, shortly after which it broke below its long-term trend line and made a lower low, finding support on its 200-DMA. Five weeks later, it retested the average, again finding support, and started another rally which, so far, has fallen short of the March high.
Note that the rally consists of five waves, but is not an impulse since the fourth wave overlaps the first. If not an impulse it is probably a diagonal, which is a corrective pattern. We could therefore expect another challenge to the 200-DMA, perhaps in the fairly near future. And you know what they say: "the third time's a charm"!
Now, let's take a look at the SPX hourly to see if we can make sense of the short-term trend.
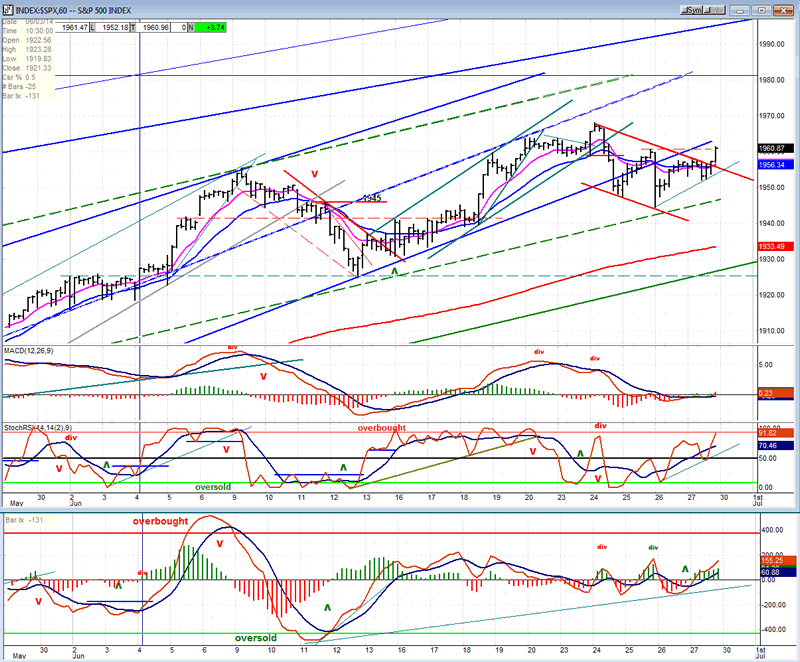
Before we do that, I want to mention that the daily momentum indicators are still in a downtrend while the daily A/D oscillator is trying to turn up. Considering this technical condition, there is no reason to expect that a strong short-term momentum should develop from this level. A better question would ask: "How much more correction might there be?"
In fact, I was surprised that the correction was so shallow. I had expected the 1939 level -- at a minimum -- to be reached instead of finding support at 1947, and then at 1945. My impression is that the rallies from those levels look suspiciously orchestrated. Besides the fact that there were valid P&F projections to the lower targets mentioned, we were correcting a move of 106 points. After breaking the trend line, a pull-back of .382 to 1928 would have been perfectly normal, especially considering the economic news which was reported at that time.
Be that as it may, it is entirely possible that we are still in a corrective mode and that we are just now coming into the top of the B wave. EW analysts are often criticized for changing their minds so often, but whatever form of technical analysis one uses, the market will more frequently than not cause you to modify your views, especially in regards to short-term trends. If you rigidly stay with your first impression, there is a very good chance that you will turn out to be wrong. That said, there is a good possibility that all the SPX is doing at this time is back-testing its breached trend line; after which it will complete its correction -- perhaps down to one of the price targets mentioned above.
After the second decline, the hourly A/D and SRSI developed an uptrend which does not look quite finished, but the MACD appears very reluctant to participate and this could warn us that this uptrend will be limited -- which is what should happen if we have not completed the correction. The decline may have found support on one of the purple parallels that I discussed in the last newsletter but is not shown on the daily chart (above). When this minor rally is completed, we might re-test that support line to complete the "C" wave and, if we move through it, we could fall as low as the heavy green trend line which represents the bottom of a large channel and roughly corresponds with the given targets.
Cycles
In last week's newsletter I mentioned the following"
"Helping to reverse the trend, the 4-wk, 6-wk, and 12-wk cycles are all due to bottom next week with the 10-wk and 22-wk due another two weeks afterward."
The 4-wk cycle could have accounted for one of the lows and the 6-12 week cycle for the other. Notice also that in the above, I mentioned that the 10-wk and 22-wk are due in the next couple of weeks; probably too far away to cause the "C" wave, but perhaps not too far to keep pressure on the market and prevent it from making a new high until they have made their lows. Cycles should only be used as guidance, so we can't say that just because these are due shortly, they will prevent the market from going to a new high, first. But we can watch to see if the market's behavior shows that it is being affected by them.
Breadth
The McClellan Oscillator and the Summation Index appear below (courtesy of StockCharts.com).
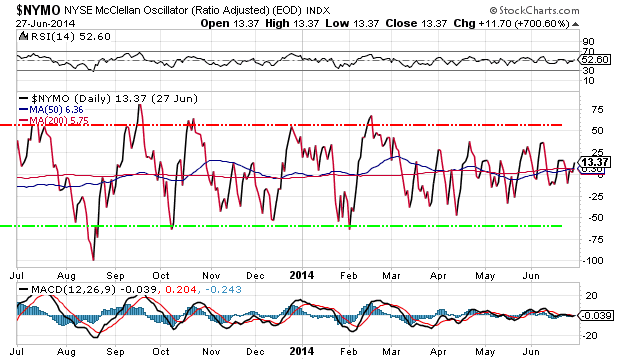
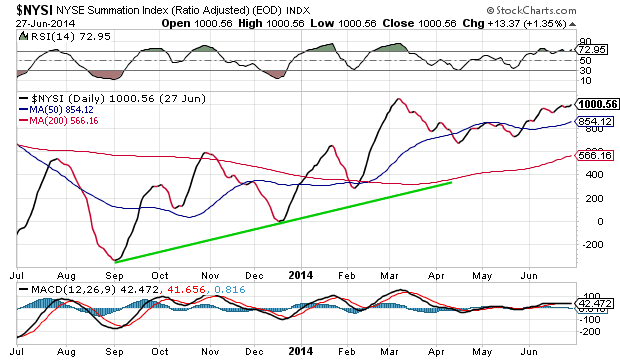
The rally of the last two days has done little to set the McClellan Oscillator on fire! It has not even equaled the height of its former peak. But since it has again become positive, it was enough to keep the NYSI in an upward crawl, and to keep the latter's RSI overbought. It's clear that both indicators are having trouble remaining afloat and that the NYSI's RSI cannot risk turning down and heading for oversold territory without setting off a powerful decline in the major indices. But then, isn't that what we soon expect to happen?
Sentiment Indicators
By remaining at 70 for 4 consecutive weeks, the SentimenTrader (courtesy of same) long term indicator is getting long in the tooth! The easiest (and perhaps only) way that this reading can be lowered to a less bearish level is by a good correction in the stock market.

All the following charts are courtesy of QuoteCharts.com
VIX (CBOE volatility Index)
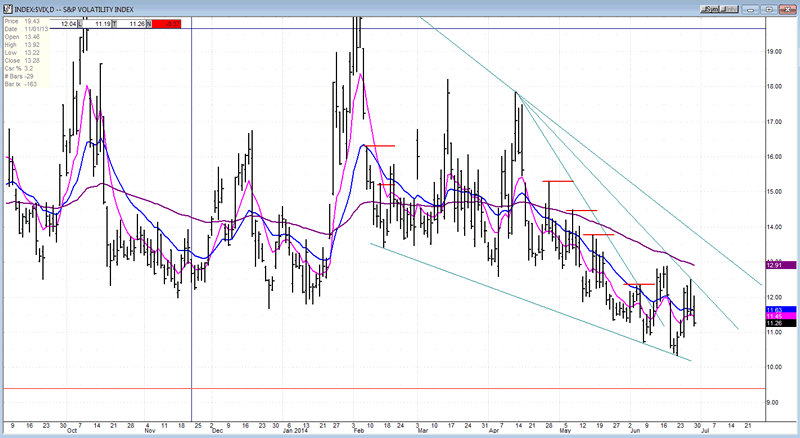
On this daily chart, VIX remains in a long-term downtrend, just recently having made its lowest low since 2007. Since this happened, a little over a week ago, it has started a small uptrend which has fallen shy of its recent short-term high. Note that it tried to get back into an uptrend in mid-June, but was unsuccessful. I suspect that when it overcomes that mid-June high, it will be the beginning of a good uptrend, matched by our first good correction in the stock market. (If it starts up from here, this could come sooner than most expect!)
XLF (Financial ETF)
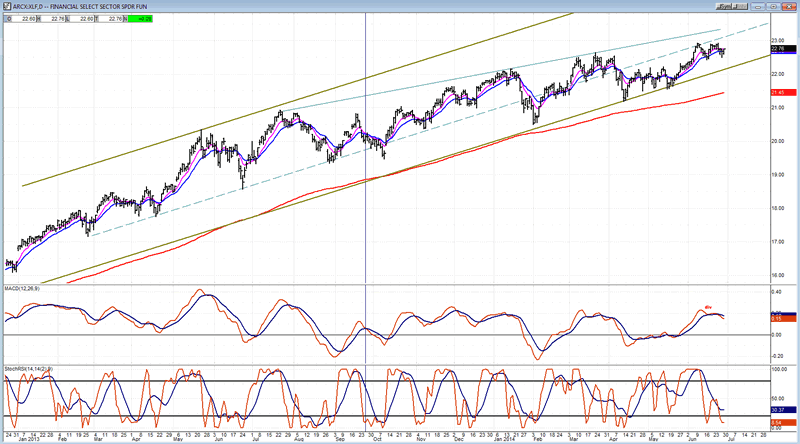
XLF is slowly decelerating! This is what the chart is showing, and it is apparently also forming a wedge pattern similar to that of the DJIA which is better defined. The last little double top is very similar to that of the DOW and if neither index can hold those short-term bottoms, it will be a sign of weakness. For the XLF it will probably mean a challenge of its intermediate trend line. For the DOW, it will most likely mean a breach of its lower wedge line.
TLT (20+yr Treasury Bond Fund)
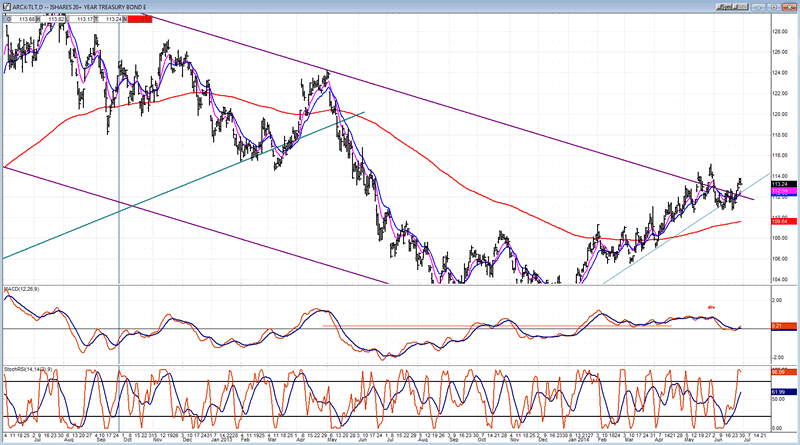
After a brief pause under the trend line, TLT appears to be on the move again. There is not enough evidence to determine whether or not the consolidation of the initial up-thrust is over or if more time is needed. Of course, it is also possible that it is making a top and will retreat below the 200-DMA, but that seems like a far less likely option at this time.
GLD (ETF for gold)
A long-term look at gold is helpful to determine its current technical position. The long-term correction which started from the 2011 top may be over after a precise 50% retracement of the long-term uptrend which started in 2005. The base formation, in the shape of a potential inverse H&S pattern, has taken about four months to build and has spanned two 25-wk cycles.
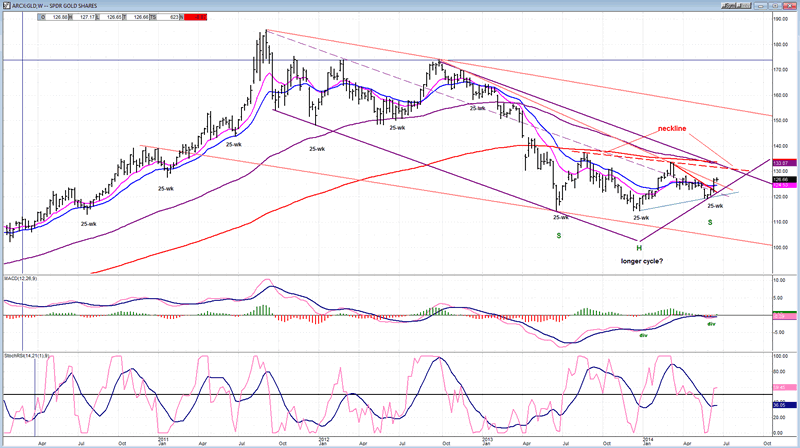
If the correction is over GLD should immediately go and challenge its neckline which is still another 5 points higher. Going through the neckline before pulling back to it would be the normal action for the index to take (if this is a genuine H&S pattern). That means that GLD could extend its move by several more points beyond the neckline before pulling back. Since the index is being propelled upward by its 25-wk cycle which just made a low, it would be an unreasonable feat to expect, especially since there is a basic P&F projection to 1940-1942. It is also possible that a larger cycle bottoming at the head of the pattern could assist in pushing the price to the suggested target.
UUP (dollar ETF)
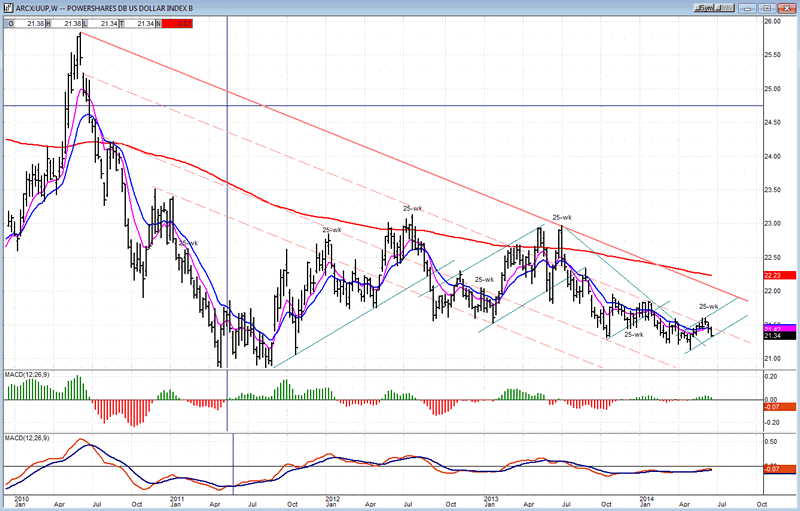
I have tentatively labeled the highs of the 25-wk cycles which affect UUP inversely to GLD. If correct, this labeling suggests that the dollar is ready for another decline, but that remains to be seen. Let's give it more time.
USO (US Oil Fund)
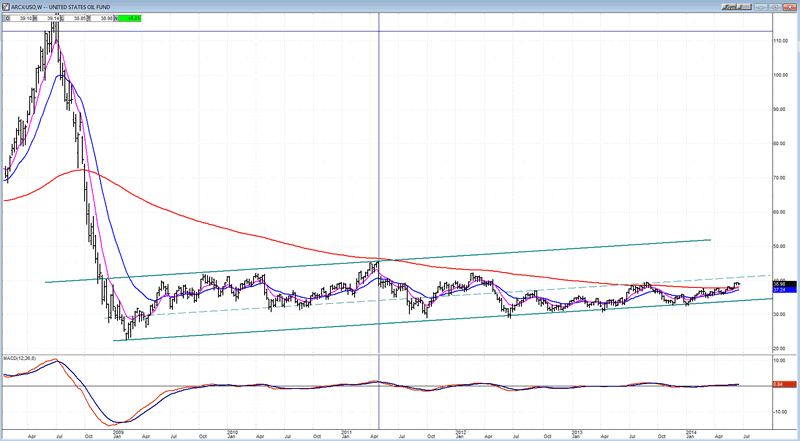
Taking a look at USO's long-term trend (weekly chart) will not be inspiring to the bulls. Certainly, this chart is masking the fact that the index is currently in a short-term uptrend. But looking at the entire bull market pattern, USO is not only moving in a lethargic long-term channel but, for the past two years, it has not been able to get past the mid-point of that channel and, instead, has been hugging the bottom channel line. Let's see if the current condition in the Middle-East can boost it to the top of the long- term channel. That would be a tall achievement for USO.
Summary
The anticipated minor top has -- so far -- caused a 23-point decline which ended last Thursday and was followed by a 16-point rally. What comes next will require additional data assessment. It is not clear if the correction is over, or if we are only in the "B" wave of the corrective pattern, with "C" still to come. The decline fell short of reaching some valid downside projections, which makes it possible that the correction is incomplete and needs to stretch a little lower. We should know before too long the near-term path on which SPX has decided.
FREE TRIAL SUBSCRIPTON
If precision in market timing for all time framesis something that you find important, you should
Consider taking a trial subscription to my service. It is free, and you will have four weeks to evaluate its worth. It embodies many years of research with the eventual goal of understanding as perfectly as possible how the market functions. I believe that I have achieved this goal.
For a FREE 4-week trial, Send an email to: ajg@cybertrails.com
For further subscription options, payment plans, and for important general information, I encourage
you to visit my website at www.marketurningpoints.com. It contains summaries of my background, my
investment and trading strategies, and my unique method of intra-day communication with
subscribers. I have also started an archive of former newsletters so that you can not only evaluate past performance, but also be aware of the increasing accuracy of forecasts.
Disclaimer - The above comments about the financial markets are based purely on what I consider to be sound technical analysis principles uncompromised by fundamental considerations. They represent my own opinion and are not meant to be construed as trading or investment advice, but are offered as an analytical point of view which might be of interest to those who follow stock market cycles and technical analysis.
Andre Gratian Archive |
© 2005-2022 http://www.MarketOracle.co.uk - The Market Oracle is a FREE Daily Financial Markets Analysis & Forecasting online publication.


