Gold/Silver Ratio Collapsed This Week, But Sits at Bottom of Price Channel
Commodities / Gold and Silver 2014 Jun 22, 2014 - 07:56 PM GMTBy: Simit_Patel
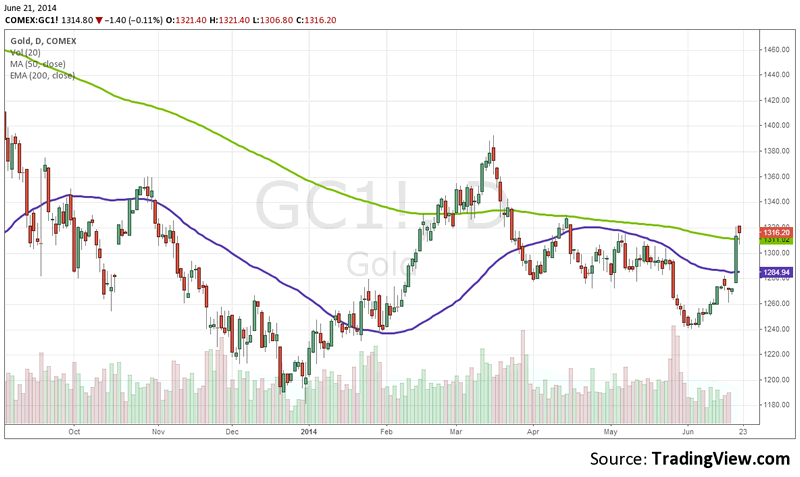
This week we saw gold and silver explode, with both gold and silver closing above the 50 SMA and 200 EMA. This hasn't been the case in silver since February, and since gold in March.
Here's a look at the gold daily chart.

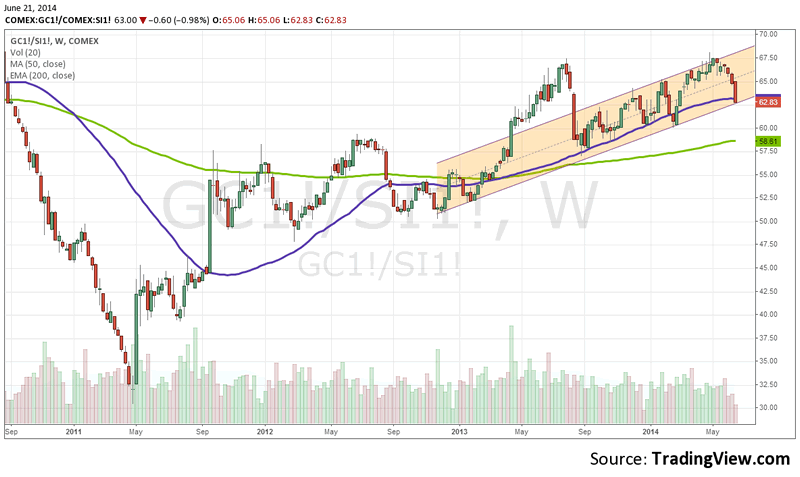
What I found especially interesting, though, is that the gold/silver ratio collapsed this week. However, it closed right at the bottom of the price channel on the ratio, which coincides with the 50 SMA on the weekly chart.

Is this time to buy the ratio?
Personally, I wouldn't; I think silver could outperform if this is truly the onset of a multi-year rally. If I was long silver and short gold, though, I think this might be a good time to close or de-risk that trade.
Incidentally, some cycle students, like Charles Nenner, expected gold to bottom in July.
By Simit Patel
http://www.informedtrades.com
InformedTrades is an online community dedicated to helping individuals learn to trade the world's financial markets. Members earn prizes for sharing their knowledge, and the best contributions are compiled into InformedTrades University, the largest collection of free organized
learning material for traders on the web.
© 2014 Copyright Simit Patel - All Rights Reserved
Disclaimer: The above is a matter of opinion provided for general information purposes only and is not intended as investment advice. Information and analysis above are derived from sources and utilising methods believed to be reliable, but we cannot accept responsibility for any losses you may incur as a result of this analysis. Individuals should consult with their personal financial advisors.
© 2005-2022 http://www.MarketOracle.co.uk - The Market Oracle is a FREE Daily Financial Markets Analysis & Forecasting online publication.


