


Stock Market SPX Uptrend to Resume Shortly
Stock-Markets / Stock Markets 2014 Jun 14, 2014 - 05:08 PM GMTBy: Tony_Caldaro

 After hitting an all time high right at the OEW 1956 pivot at noon Monday, the market went into pullback mode for the rest of the week. For the week the SPX/DOW were -0.8%, the NDX/NAZ were -0.4%, and the DJ World index lost 0.3%. On the economic front, positive reports edged out negative ones for the week. On the uptick: business/wholesale inventories, retail sales, export prices, the monetary base, plus the budget deficit improved. On the downtick: the PPI, the WLEI, consumer sentiment, plus weekly jobless claims rose. Next week should be a busy one. Besides the FOMC meeting Tues/Wed, we have Options expiration Friday, plus reports on Capacity utilization and Housing. Best to your week!
LONG TERM: bull market
Five years ago, hardly anyone thought we were starting a bull market. Three years ago, most thought the bull market ended in the spring of 2011. Two years ago, hardly anyone was expecting new all time highs. Last year, nearly everyone turned bullish at new all time highs. This year, the market is still adding to those highs. It has been quite a five year run.
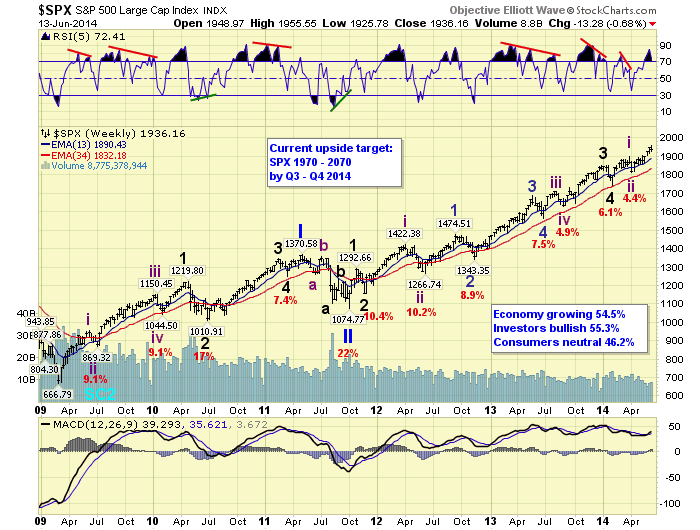
We continue to count this bull market as Cycle wave [1] of a new multi-decade Super cycle bull market. Cycle wave bull markets unfold in five Primary waves. Primary waves I and II completed in 2011, and Primary wave III has been underway since then. Primary I divided into five Major waves with a subdividing Major wave 1. Primary III has divided into five Major waves too. But it has had a simple Major wave 1, and subdividing Major waves 3 and 5. Thus far it continues to look like we are currently in an Intermediate wave iii uptrend, of Major wave 5. When this uptrend concludes we should have a downtrend/correction for Int. wave iv. Then an uptrend, to new highs, for Int. wave v. These last waves should then complete Primary III. Our upside target remains SPX 1970-2070 by Q3/Q4 2014.
MEDIUM TERM: uptrend
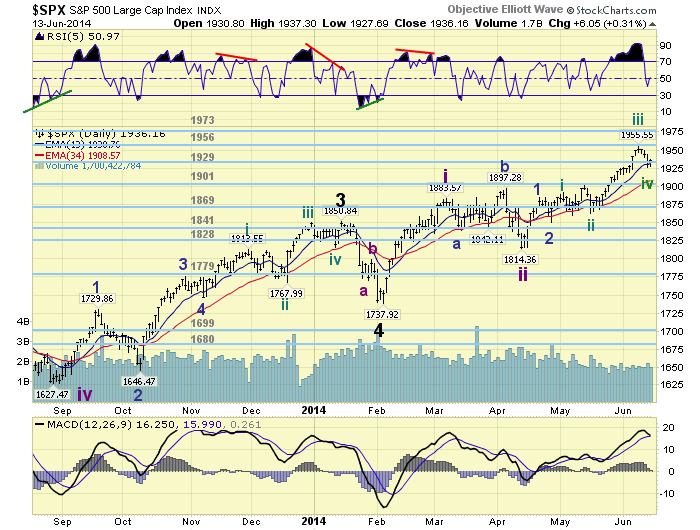
This Int. wave iii uptrend began in mid-April at SPX 1814. Thus far, it looks like we have completed Minor waves 1 and 2 at SPX 1885 and 1851. Then Minute waves i-ii-iii-and possibly iv at SPX 1891-1862-1956-1926. The next rally to new highs should complete Minute wave v, and Minor wave 3. Then after a Minor wave 4 pullback, another series of new highs should complete Minor wave 5 and the uptrend.
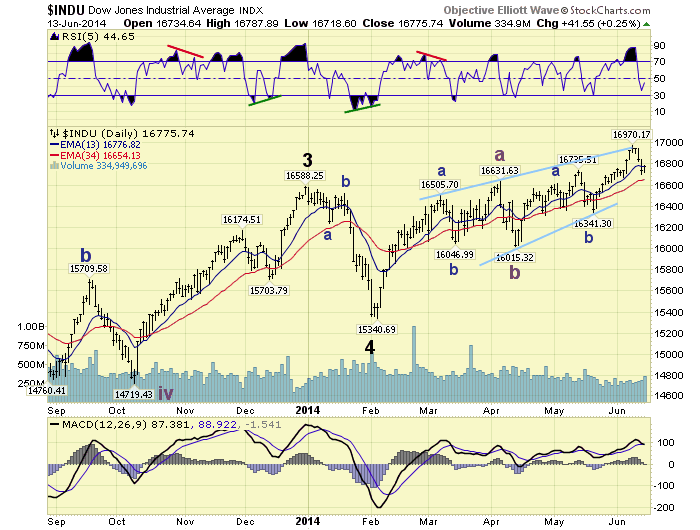
While the SPX/NDX/NAZ indices continue to unfold in impulsive uptrends. The DOW continues to look choppy, like it did during its last uptrend. Notice that the DOW is only about 1% above its April uptrend high. Even after a two month uptrend. The SPX, in comparison, is currently about 2% higher. Also the DOW continues to look like it is forming a diagonal triangle Major wave 5. Notice how the price action fits within a rising wedge. This pattern can not be applied to the SPX. Despite the negative implications of this pattern. The DOW should follow the same trend/wave scenario, noted above, to complete Major wave 5. Only it will probably continue to underperform.
Medium term support for the SPX is at the 1929 and 1901 pivots, with resistance at the 1956 and 1973 pivots.
SHORT TERM
Short term support is at the 1929 pivot and SPX 1916-1919, with resistance at the 1956 and 1973 pivots. Short term momentum ended the week above neutral. The short term OEW charts are positive with the reversal level now SPX 1935.
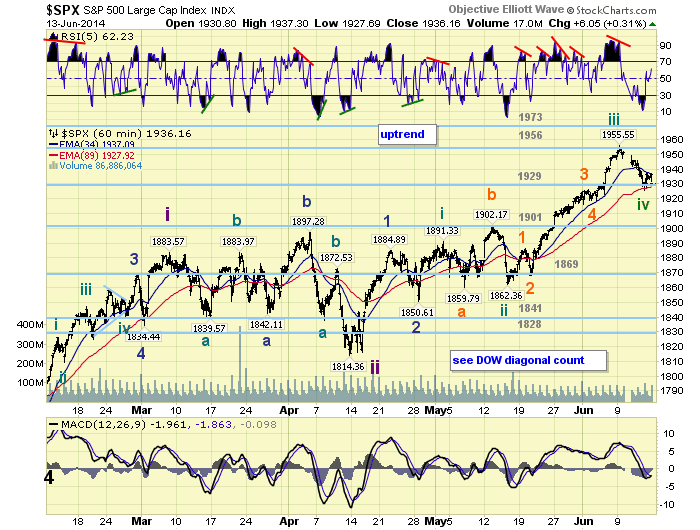
We had been expecting Minute wave iii to reach the OEW 1956 pivot range. We were quite surprised to see it end right at SPX 1956 on Monday. The 30 point pullback that followed to Thursday’s low of SPX 1926, was the largest pullback since Minute wave ii declined 31 points. Since we were looking for Minute wave iv support in the OEW 1929 pivot range, we believe the pullback ended there. Off that low the SPX rallied to 1937 on Friday. This was the largest rally by far, since the SPX 1956-1926 decline began. Previous rallies were only 6 points, at best. Once the market clears SPX 1937, which was hit twice on Friday, Minute v should be underway to new highs.
With all the economic activity next week we would not be surprised to see lots of volatility. In fact, Minor 3/Minute v could end just before or right after the FOMC statement on Wednesday. Then Friday’s Option expiration could set up another swift move down for Minor wave 4 into the following week. With the Iraq situation in the forefront, and the Ukraine situation in the back ground, it could be a volatile mid to end of June. We are still expecting the OEW 1973 pivot to be hit before this uptrend ends.
FOREIGN MARKETS
The Asian markets were mixed on the week for a net gain of 0.2%.
The European markets were mostly lower losing 0.7%.
The Commodity equity group were all higher gaining 1.8%.
The DJ World index continues to uptrend but lost 0.3%.
COMMODITIES
Bond prices confirmed a downtrend this week losing 0.7%.
Crude confirmed an uptrend this week gaining 4.0%.
Gold again is in rally mode, gaining 1.7%, but no uptrend confirmation yet.
The USD continues to uptrend and gained 0.2%.
NEXT WEEK
Monday: NY FED at 8:30, Industrial production at 9:15, and NAHB housing at 10am. Tuesday: Housing starts, Building permits, and the CPI. Wednesday: FOMC statement. Thursday: weekly Jobless claims, the Philly FED, and Leading indicators. Friday: Options expiration. Best to your weekend and week!
CHARTS: http://stockcharts.com/public/1269446/tenpp
http://caldaroew.spaces.live.com
After about 40 years of investing in the markets one learns that the markets are constantly changing, not only in price, but in what drives the markets. In the 1960s, the Nifty Fifty were the leaders of the stock market. In the 1970s, stock selection using Technical Analysis was important, as the market stayed with a trading range for the entire decade. In the 1980s, the market finally broke out of it doldrums, as the DOW broke through 1100 in 1982, and launched the greatest bull market on record.
Sharing is an important aspect of a life. Over 100 people have joined our group, from all walks of life, covering twenty three countries across the globe. It's been the most fun I have ever had in the market. Sharing uncommon knowledge, with investors. In hope of aiding them in finding their financial independence.
Copyright © 2014 Tony Caldaro - All Rights Reserved Disclaimer: The above is a matter of opinion provided for general information purposes only and is not intended as investment advice. Information and analysis above are derived from sources and utilising methods believed to be reliable, but we cannot accept responsibility for any losses you may incur as a result of this analysis. Individuals should consult with their personal financial advisors.
Tony Caldaro Archive |
© 2005-2022 http://www.MarketOracle.co.uk - The Market Oracle is a FREE Daily Financial Markets Analysis & Forecasting online publication.