Gold Price Finally Bombed Out
Commodities / Gold and Silver 2014 Jun 14, 2014 - 12:44 PM GMTBy: Aden_Forecast
 Gold dropped sharply a couple of weeks ago. Many experts can't explain why, but there are several reasons that make sense...
Safe Haven?
First, gold entered a seasonally slow period. This could last for another month or so but seasonality alone doesn't explain why the decline was so steep and sudden.
More impressive, gold's safe haven appeal has diminished somewhat. Following the Ukraine elections, for instance, concerns eased. But with Iraq now heating up, gold could continue its current rebound rise.
The Technical Picture
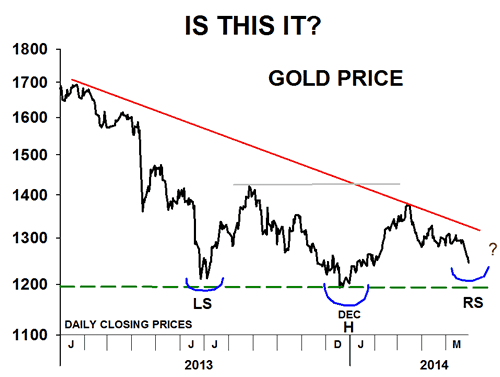
Meanwhile, gold had strong support at $1280. This level had been tested several times but it clearly broke.
This means gold will probably continue to hold above the $1200 area. It also suggests gold could continue forming a head and shoulders bottom (see LS, H, RS on Chart 1).

Plus, there are growing signs indicating this could end up being the bottom for this decline, which has been in force since 2011- 12.
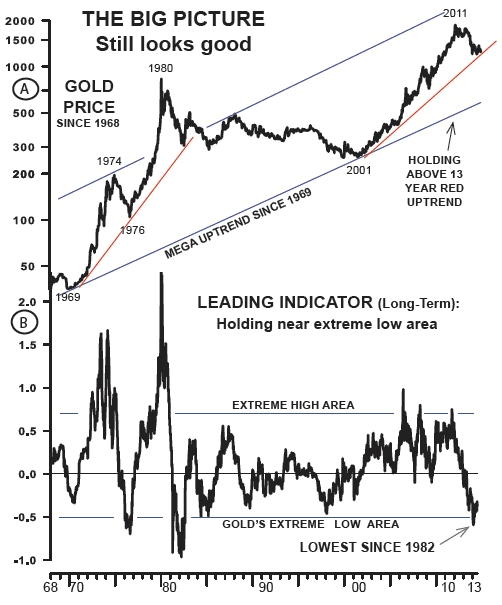
Looking at gold's big picture since 1968, you'll see what we mean.
Chart 2A shows that gold's decline of the last few years looks small in the big picture, within the mega uptrending channel since 1968.

Note that gold has had two major bull markets, in the 1970s and in the 2000s.
The major rise in the 70s didn't break its bull market red uptrend until 1984, several years after the peak in 1980.
The bull market red uptrend since 2001, however, is still intact. On a big picture basis, it'll be important to see if this trend holds. That is, as long as gold stays above the lows of last year, at $1210, this trend will stay solid.
And according to gold's leading long term indicator (B), it's saying that gold remains at an extreme low area... In fact, this is the lowest it's been since the 1980s.
Since these low areas tend to coincide with bottoms in the gold price, this tells us that gold is totally bombed out and the lows of last year are unlikely to be broken.
This doesn't mean gold will soar from here. Eventually yes, but for now we could see more backing and filling.
All things considered, it looks more like 2015 could be the year of a strong change to the upside.
Deflation Gaining Momentum
One important reason why is because deflationary pressures have been intensifying.
Although there has been some improvement, global economies remain sluggish, despite massive stimulus efforts from the biggest central banks in the world.
This suggests that stimulus measures will likely continue in order to boost the global economies. And even though these measures may eventually cause inflation, the current economic sluggishness is stubborn and it's feeding deflation.
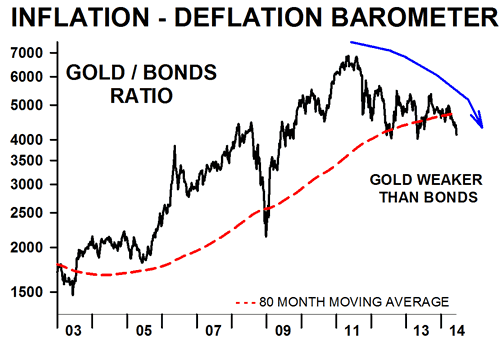
Our inflation-deflation barometer is an indicator that measures rising inflation against falling deflation by using a ratio between gold and bonds.
Historically, gold has been used to measure inflation and bonds have measured deflation.
Chart 3 shows the ratio of the two since 2003. Notice the steady rise in gold (inflation) against bonds (deflation) through 2011. Moreover, after the 2011 peak in gold, bonds began to strengthen against gold and they've continued to be stronger since then.

In other words, we could still see bonds strengthen even more against gold in the months ahead. This would coincide with a sluggish economic outlook. But again, that may not be the case for long.
Silver is Cheap
At the same time, silver is super cheap. It's also cheap compared to most of the other markets.
Demand for silver is also very good. A recent report said that physical demand rose to a record last year.
This growing demand ties in well with the technical situation in silver. It too is bombed out and, like gold, it'll likely head higher in the upcoming months.
By Mary Anne & Pamela Aden
Mary Anne & Pamela Aden are well known analysts and editors of The Aden Forecast, a market newsletter providing specific forecasts and recommendations on gold, stocks, interest rates and the other major markets. For more information, go to www.adenforecast.com
Aden_Forecast Archive |
© 2005-2022 http://www.MarketOracle.co.uk - The Market Oracle is a FREE Daily Financial Markets Analysis & Forecasting online publication.


