Gold Price Slipping Again While Silver Sees Further Risk
Commodities / Gold and Silver 2014 Jun 03, 2014 - 10:50 AM GMTBy: GoldSilverWorlds
 Gold: Slipping again
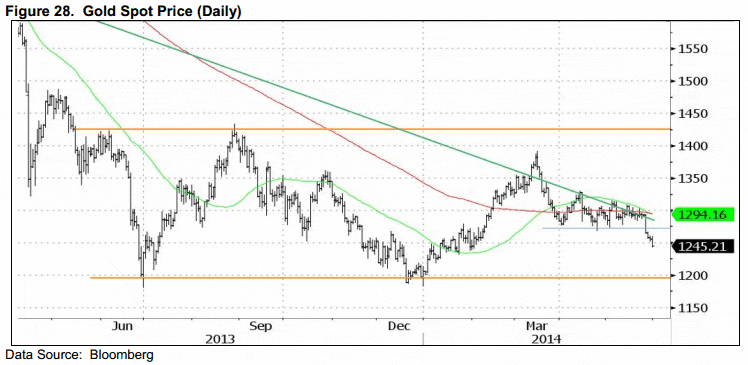
Gold Spot price (GOLDS-1,249.73, see Figure 28) retained a tight trading range through April and May, allowing speculation as to resolution. We have been neutral awaiting technical evidence of a directional move which has now taken place to the downside, breaking the lower band of the tight trading range and failing under the 2012 downtrend again.
The breakdown now suggests that there is a good possibility that 1,200 will again be tested. The wide trading range between 1,200 and roughly 1,400 has lasted for two years, not unexpected considering the degree of the prior decline. Now the momentum models from all three timeframes, daily, weekly and monthly are all negative, suggesting the decline could continue.
If 1,200 cannot hold, the bear market for Gold that began in 2011 will be extending to a new down-leg and there again would be further risk toward 1,100.

The S&P 500 to Gold ratio depicted herein last month has moved up in favor of the S&P 500 outperforming over Gold.
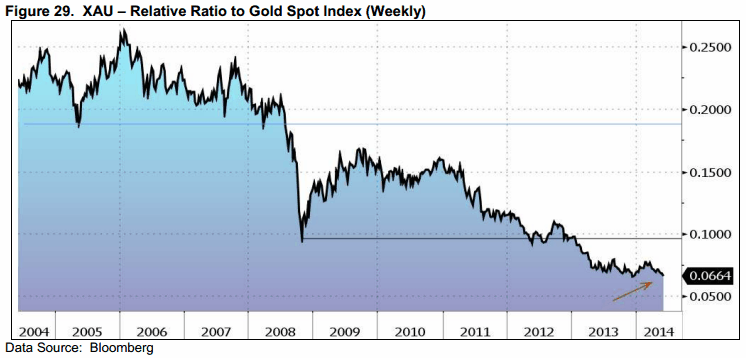
We have been very skeptical of owning Gold stocks since 2008 when the XAU / GOLDS ratio broke down, showing structural outperformance of Gold over the stocks (see Figure 29). The reason related directly to the Gold ETFs which enabled investment directly in the bouillon, avoiding fundamental stock risks.

A further breakdown occurred in 2013 and now the ratio looks poised for another break (see arrow), furthering the underperformance of the Gold stocks.
Silver: Further risk
Silver Spot price (SILV-18.82, see Figure 30) is failing along with Gold, currently below both MAs and breaching support at 19; risk 18 or lower. A lift through 19 again and then 20 would now be needed to suggest another rally attempt.

Platinum: Neutral
Platinum spot price (PLAT-1,452.75, see Figure 31) has moved little, retaining a sideways pattern above support at 1,400 and 1,325 for nearly a year, and more recently in a narrower range between 1,400 support and 1,500 resistance. The three-year downtrend remains in place, currently intersecting at 1,550, and weekly and monthly momentum are still barely positive and barely negative respectively … effectively still neutral. Price needs to exceed 1,500 to reverse the more negative bias of the downtrends. But maintaining the higher support at 1,400 is a short–term technical positive, any breach of which could return price to 1,300.

Palladium: Breakout extends
Palladium spot price (PALL-837.25) has consistently remained the strongest of the metals we cover and has continued to extend gains after successfully penetrating the trading range resistance near 790 (as depicted herein last month). The next outstanding resistance is at 851 from 2011, which price could easily achieve. The current support is 800, the point of breakout.
Subscribe to the monthly analysis of Louise Yamada for in-depth insights on ongoing market activity: www.lyadvisors.com.
One of the most respected technical analysts we are following is Louise Yamada. Her independent research company provides in-depth and thought-provoking analysis on all markets, including precious metals. She has a background of 25 years at Smith Barney and was top-ranked in “Institutional Investor” for four years in a row, before going independent.
We have been following Yamada’s work for a long time and appreciate her analysis because it is truly unbiased, very sharp and broad (it covers plenty of markets worldwide). An outstanding feature of the analysis is that readers are offered different perspectives on each market, which sometimes reveals trends that are rather invisible. For precious metals investors it helps to put the metals markets activity in a broad perspective of ongoing market trends. In other words, understanding broad market activity is helpful to interpret the state of the metals market.
Source - http://goldsilverworlds.com/price/gold-price-slipping-again-while-silver-sees-further-risk/
© 2014 Copyright goldsilverworlds - All Rights Reserved Disclaimer: The above is a matter of opinion provided for general information purposes only and is not intended as investment advice. Information and analysis above are derived from sources and utilising methods believed to be reliable, but we cannot accept responsibility for any losses you may incur as a result of this analysis. Individuals should consult with their personal financial advisors.
© 2005-2022 http://www.MarketOracle.co.uk - The Market Oracle is a FREE Daily Financial Markets Analysis & Forecasting online publication.


