


Stock Market Sell in May? 7.5% Drop Possible
Stock-Markets / Stock Markets 2014 Jun 01, 2014 - 05:18 PM GMTBy: Brad_Gudgeon

 Last time, I was looking for an important low on June 3. I believe the normal cycle tops due earlier this month and again last Tuesday have extended. In the past, whenever this has occurred we have seen a more important drop ahead than 4-6%.
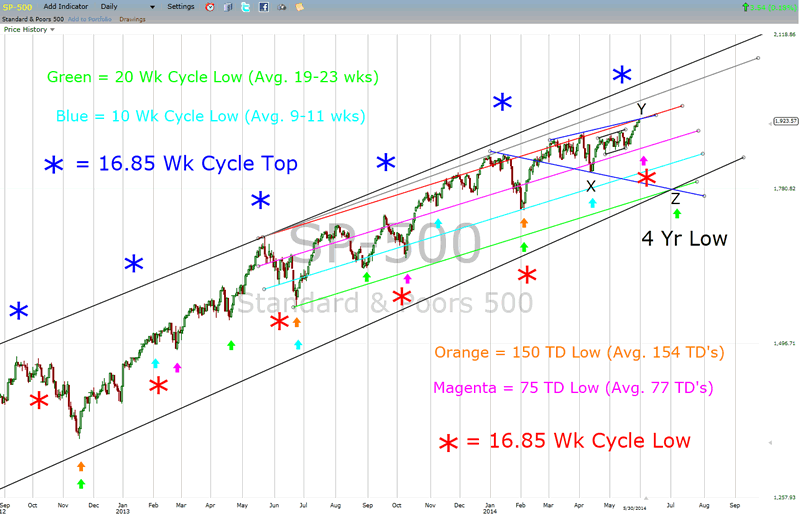
On the chart below, there are cycles and lines of resistance noted. Where we are right now is unusually similar to the May 22, 2013 top. The rising bottoms line connects the Mar ’09 and Oct ’11 bottoms and joins the blue descending line from the Jan ’14 top to the April ’14 bottom (marked in E-Wave as X), along with the rising green line.
The expected June 3 low (the Gann 16 (+2)/ 75 (+6) TD/118 CD low) is likely an initiation low coming off the June 2 expected top at SPX 1924, and should hold the magenta rising line near 1863/64 (the last 4-yr cycle low in ‘10 also had an early Feb low like this year and 21 weeks later the 4yr. cycle low joined in).
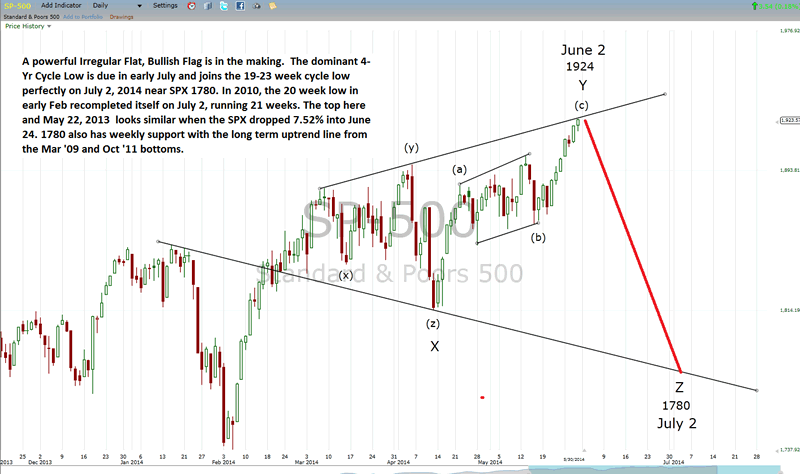
The next chart shows the e-wave notation of a powerful, irregular bullish flat flag that should launch this market higher, perhaps even into October of next year. Everyone is looking for the 12 –yr cycle low this year and normally in the past, these cycles have coincided with 20% bear markets. The only exception I can see going back through the years is 1954, where the market just kept on rising.
Normally, the stock markets in the past have been running in 4 and 8 year cycles. The bull from 2002 to 2007 (and the bear into 2009) changed the normal course of this cycle which in 2006 failed to produce a bear market (almost in 2010, but then in 2011). We may be on a similar course here with a late 2015 top and a larger bear looming than the 2007/2009 crash into the 2016/2017 time frame.
Good Trading!
Mr. Brad Gudgeon
http://www.blustarmarkettimer.info
BluStar Market Timer Investment Philosophy: The stock market is currently in a technical Elliott Wave Bear Market Rally. It has been exhibiting A-B-C type waves instead of the normal 5 Waves since the market topped in 2000. According to “The Original Works of R.N. Elliott”, we are due for a move down to about the S&P 500 442/443 area in the next few years. In my opinion, this is no longer a buy and hold market, but a traders’ market. We mainly swing trade the market with funds and ETF’s, but otherwise trade according to the market’s disposition and to the traders’ discretion. For the year 2014, BluStar Market Timer is rated #1 according to Timer Trac.
Copyright 2014, BluStar Market Timer. All rights reserved.
Disclaimer: The above information is not intended as investment advice. Market timers can and do make mistakes. The above analysis is believed to be reliable, but we cannot be responsible for losses should they occur as a result of using this information. This article is intended for educational purposes only. Past performance is never a guarantee of future performance.
© 2005-2022 http://www.MarketOracle.co.uk - The Market Oracle is a FREE Daily Financial Markets Analysis & Forecasting online publication.