


Will GBP/USD Plunge Again?
Currencies / Forex Trading May 29, 2014 - 06:00 PM GMTBy: Nadia_Simmons

 Earlier today, the Bureau of Economic Analysis reported that U.S. gross domestic product in the first quarter declined for the first time since the first quarter of 2011. Despite this bearish data, the report also showed that consumer spending increased by 3.1%, indicating that economic activity has rebounded. Additionally, the Department of Labor showed in its weekly report that initial claims for jobless benefits in the U.S. last week fell by 27,000 to 300,000, beating expectations for a decline of 9,000. Thanks to these better-than-expected numbers, the U.S. dollar bounced off the session low, pushing the British pound below the 50% Fibonacci retracement once again. Will this decline trigger further deterioration?
In our opinion, the following forex trading positions are justified - summary:
EUR/USD: short (stop-loss order: 1.4040)
GBP/USD: none
USD/JPY: none
USD/CAD: none
USD/CHF: none
AUD/USD: short (stop-loss order: 0.9410)
EUR/USD
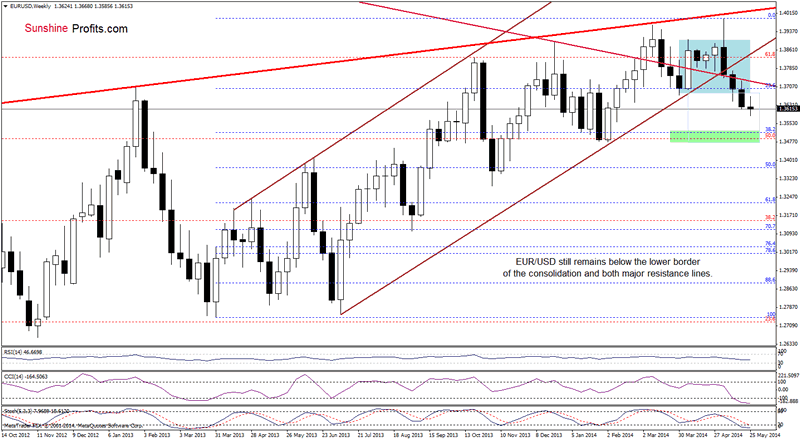
On the weekly chart, we see that the situation hasn’t changed much as EUR/USD remains near its 3-month low. Therefore, our last commentary on this currency pair is up-to-date:
(…) as long as there is no invalidation of the breakdown under these lines, further deterioration is likely. If this is the case, and the exchange rate extends losses in the coming week (or weeks), the downside target will be around 1.3516 (where the 38.2% Fibonacci retracement based on the entire March 2013-May 2014 is) or even slightly lower – around 1.3480, where the bottom of the previous bigger correction (between Dec. and Feb.) is .
Once we know the above, let’s focus on the daily chart.
In our Forex Trading Alert posted on May 22, we wrote the following:
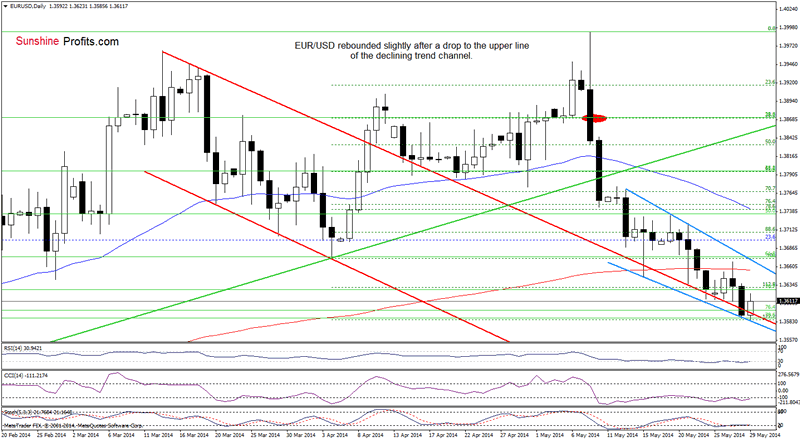
(…) the pair will likely re-test the strength of the upper border of the declining trend channel (…) this area is also supported by the 70.7% Fibonacci retracement (based on the entire Feb.-May rally) and the 128.2% Fibonacci extension (based on the Apr.-May rally). If this strong support (…) is broken, EUR/USD will extend losses and the initial downside target will be around 1.3586-1.3598, where the 76.4% and 78.6% Fibonacci retracement levels are.
Looking at the daily chart, we clearly see that EUR/USD extended losses and hit the above-mentioned downside target earlier today. With this downswing, the pair reached not only the upper border of the declining trend channel, but also the lower line of the declining wedge (marked with blue), which serve as an additional support. Taking this fact into account, what we wrote yesterday is still valid:
(…) If the combination of this major support line and Fibonacci retracements withstands the selling pressure, we may see a comeback to the previously-broken 200-day moving average (the position of the daily indicators supports this scenario at the moment). However, if this strong support zone doesn’t encourage forex traders to push the buy button, we will likely see further deterioration and the next downside target will be around 1.3540, where the 88.6% Fibonacci retracement (based on the entire Feb.-May rally) meets the 141.4% Fibonacci extension (based on the Apr.-May rally).
Before we summarize this currency pair, we would like to emphasize the quote from our Forex Trading Alert posted on May 19:
(…) In our opinion, the breakout in the USD Index above the medium-term resistance line can trigger a significant rally soon - even without the above-mentioned correction. Therefore, we remain bearish on EUR/USD.
Very short-term outlook: bearish
Short-term outlook: bearish
MT outlook: bearish
LT outlook: bearish
Trading position (short-term; our opinion): Short. Stop-loss order: 1.4040. The short position (the area where it was opened we marked with a red ellipse) featured on May 8th when EUR/USD was still above the 50-day moving average (blue line in the chart) remains profitable.
GBP/USD
In our Forex Trading Alert posted on Friday, we wrote the following:
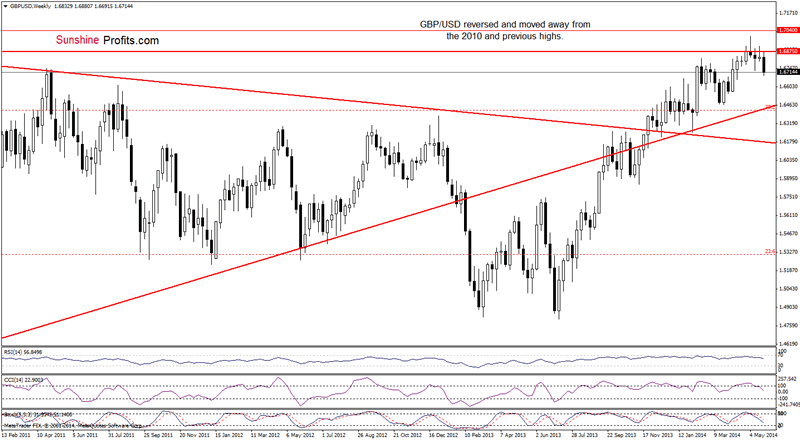
(…) GBP/USD still remains slightly below the resistance zone created by the Nov. 2009 and May highs. If this area encourages forex traders to push the sell button, we will likely see a correction in the coming week (this scenario is currently in tune with sell signals generated by the CCI and Stochastic Oscillator).
Yesterday, we added:
(…) we noticed such price action this week. With the downward move, the pair approached the May low, but it seems doubtful to us that this support level stop further deterioration.
As you see on the above chart, the situation in the medium term has deteriorated as GBP/USD extended losses and hit a fresh May low. How far could the pair drop from here? Let’s see the daily chart.
In our last commentary on this currency pair, we wrote the following:
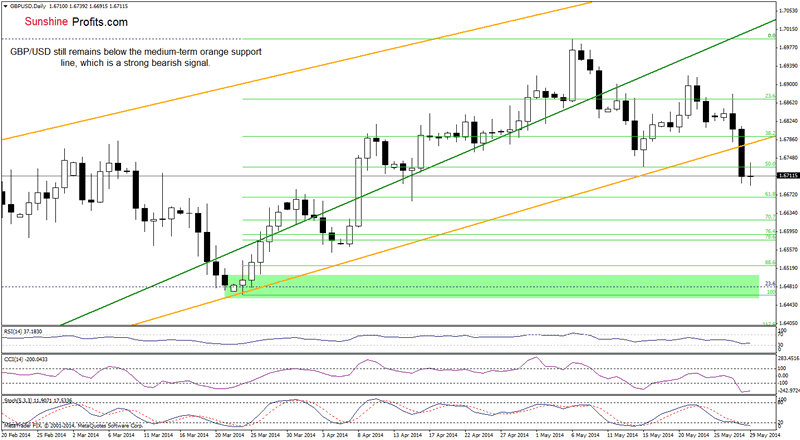
(…) we should keep in mind that another sizable downswing will be likely only if the pair declines below the medium-term orange support line.(…) If the breakdown is not invalidated, such price action will likely trigger further deterioration and the initial downside target will be around 1.6666, where the 61.8% Fibonacci retracement (based on the March-May rally) and the Apr. 15 low are.
On the above chart, we see that the current correction accelerated after the breakdown below the above-mentioned major support line. With this downswing, GBP/USD dropped below the 50% Fibonacci retracement (based on the March-May rally) and it seems to us that currency bears will realize the above-mentioned scenario in the coming days.
Very short-term outlook: bearish
Short-term outlook: bearish
MT outlook: bearish
LT outlook: mixed
Trading position (short-term): In our opinion, no positions are justified from the risk/reward perspective.
AUD/USD
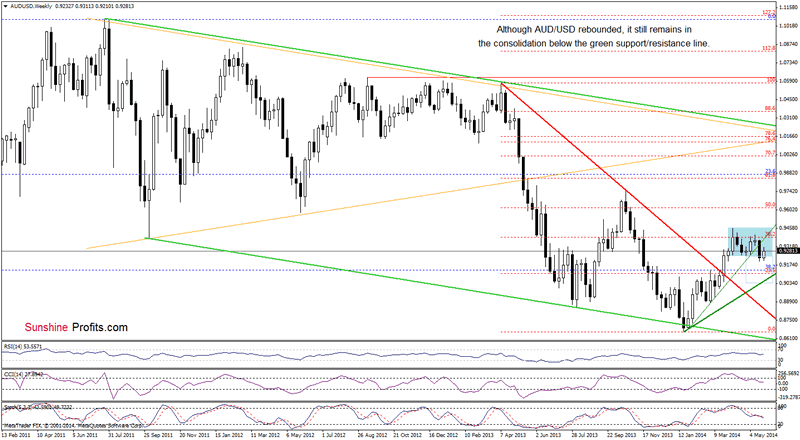
Although the medium-term situation has improved slightly as AUD/USD rebounded and came back to the consolidation range, the pair still remains below the previously-broken green resistance line. Additionally, sell signals generated by the indicators remain in place, supporting the bearish case.
Having say that, let’s focus on the short-term picture.
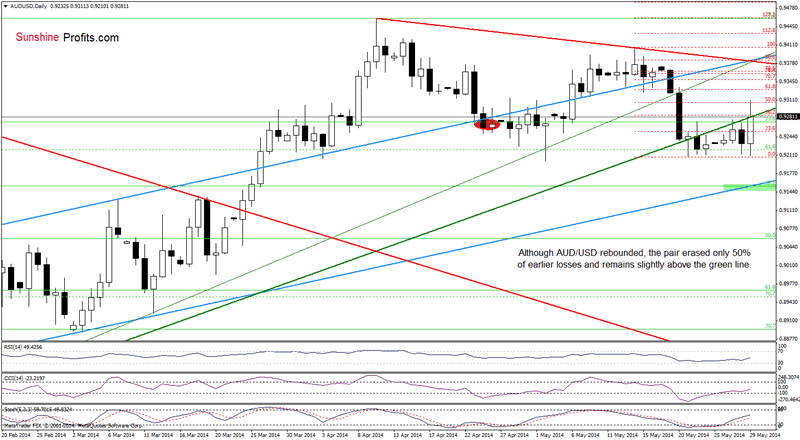
Looking at the daily chart, we see that although AUD/USD moved higher and came back above the medium-term green resistance line, the 50% Fibonacci retracement based on the recent declines stopped gains. Thanks to this resistance level, the exchange rate reversed, approaching the previously-broken green line. In our opinion, if the pair moves lower and closes the day below it, this will be a strong bearish signal (an invalidation of a breakout) and we’ll see further deterioration in the coming days. In this case, the initial downside target will be a resistance zone created by the May and today’s lows. However, if currency bulls do not give up and push the pair higher, we think that a strong resistance zone (around 0.9380) created by the previously-broken thin green resistance line, the blue rising line and the red declining line based on the previous highs will be strong enough to stop further improvement.
Very short-term outlook: bearish
Short-term outlook: bearish
MT outlook: bearish
LT outlook: bearish
Trading position (short-term; our opinion): Short (the area where it was opened we marked with a red ellipse). Stop-loss order: 0.9410.
Thank you.
Nadia Simmons
Sunshine Profits‘ Contributing Author
Oil Investment Updates
Oil Trading Alerts
* * * * *
Disclaimer
All essays, research and information found above represent analyses and opinions of Nadia Simmons and Sunshine Profits' associates only. As such, it may prove wrong and be a subject to change without notice. Opinions and analyses were based on data available to authors of respective essays at the time of writing. Although the information provided above is based on careful research and sources that are believed to be accurate, Nadia Simmons and his associates do not guarantee the accuracy or thoroughness of the data or information reported. The opinions published above are neither an offer nor a recommendation to purchase or sell any securities. Nadia Simmons is not a Registered Securities Advisor. By reading Nadia Simmons’ reports you fully agree that he will not be held responsible or liable for any decisions you make regarding any information provided in these reports. Investing, trading and speculation in any financial markets may involve high risk of loss. Nadia Simmons, Sunshine Profits' employees and affiliates as well as members of their families may have a short or long position in any securities, including those mentioned in any of the reports or essays, and may make additional purchases and/or sales of those securities without notice.
© 2005-2022 http://www.MarketOracle.co.uk - The Market Oracle is a FREE Daily Financial Markets Analysis & Forecasting online publication.