


Silver to Gold Ratio: 27 Years of Price Data
Commodities / Gold and Silver 2014 May 27, 2014 - 02:44 PM GMTBy: DeviantInvestor

 Statistically, gold and silver prices closely follow each other. But what is more important is the ratio between silver and gold and the trend of that ratio.
Examine the following chart.
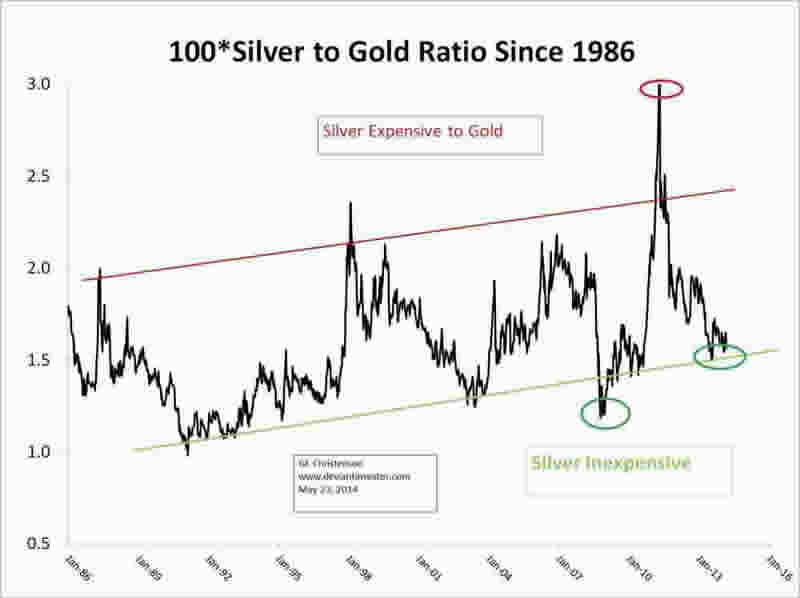
We can see that:
- For the past 27 years (after the 1980 bubble and subsequent correction) the ratio has been in a slow up-trend.
- The silver peak near $50 in April 2011 clearly stands out as an anomaly.
- The silver lows in 2008 and 2013 were at or below the trend lines, as I have drawn them. Silver rallied considerably after the 2003 and 2008 ratio lows. I expect the same will occur after the recent lows in the ratio.
- The ratio can explode higher in a few months or languish for years.
My conclusions from this graph are that the silver-to-gold ratio is currently priced at the low end of the range, long-term silver prices are gradually increasing relative to gold, and a price explosion could occur at any time, or perhaps not for several years.
Is there more we can learn from the ratio?
Take the weekly prices for silver and the weekly silver-to-gold ratio and smooth them with a 7 week centered simple moving average. This merely removes some of the “noise” in the graphs. Plot that weekly data since 2002, roughly the beginning of the silver and gold bull markets. Examine that graph.
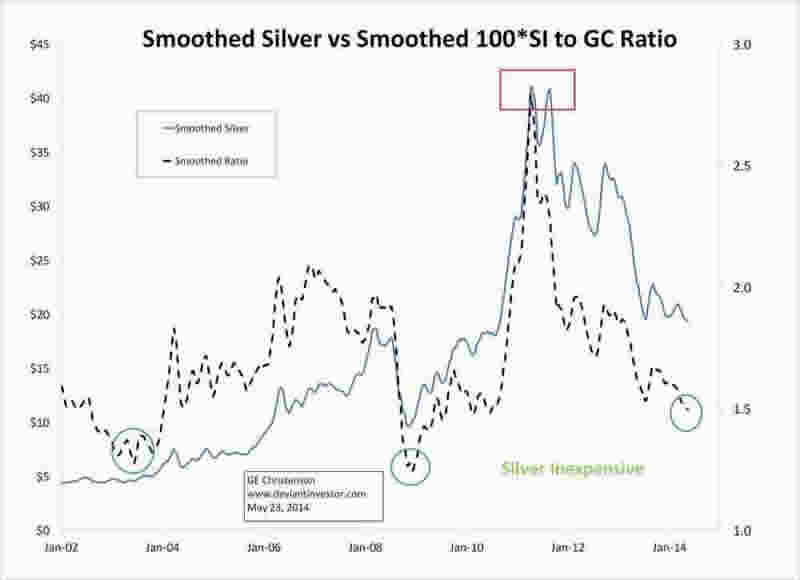
- You can see that silver prices generally follow the ratio. This merely tells us that silver prices move both up and down more rapidly than gold prices but that they generally move together.
- The ratio has fallen hard in the past 3 years – back to levels seen in 2009 and 2003, before large rallies in the price of silver.
- The silver-to-gold ratio is currently low – about 0.015, the inverse of gold-to-silver ratio of about 66, which is quite high.
Statistics
- From January 2002 to May 2014 (12+ years) the statistical correlation between the weekly smoothed silver price and the weekly smoothed ratio was 0.67.
- From May 2008 to May 2014 (6 years since the start of the crash) the statistical correlation between the weekly smoothed silver price and the weekly smoothed ratio was 0.87 – quite high.
- The mean of the weekly data on the smoothed 100 x silver-to-gold ratio for the past 12 years is 1.71 with a standard deviation of 0.28.
- The mean of the weekly data on the smoothed 100 x silver-to-gold ratio since the 2008 start of the crash is 1.75 with a standard deviation of 0.31.
- Based on the past 12 years, the ratio is currently 0.78 standard deviations below the mean. Similarly, based on the nearly 6 years since the crash, the ratio is 0.84 standard deviations below the mean.
Based on the ratio data and the statistics, we can conclude that:
- The ratio is low and in the zone of the 27 year trend-line where we can reasonably expect the ratio to turn up.
- Silver prices increase and decrease with both the silver-to-gold ratio and gold prices, only more rapidly than gold.
- The ratio is well below (about 0.8 std. dev.) the last 6 and 12 year means and is likely to turn up. Hence the price of silver is very likely to rally in the next few months or so.
Fundamentals
Gold demand is strong – ask China, Russia and India. Western central banks have “leased” some, or perhaps most, of their gold. The German gold stored at the NY Fed was not returned – possibly because it is no longer in the vaults. See Julian Phillips’ analysis on that topic. If most of the central banks’ gold is gone (“leased” into the market), demand will soon overwhelm the supply of real, physical gold. The High-Frequency Traders can suppress the paper market, but not forever.
It is a reasonable bet that gold, about 40% below its 2011 high and facing large demand and dwindling supply, will rally in price over the next few years. Silver prices will follow gold prices but rally farther and faster from their currently low and oversold condition.
Was the above analysis a conclusive proof that gold and silver prices must rally? Obviously not!
But it strongly suggests:
- Silver has been correcting for over three years. It could rally at any time.
- Silver prices are currently LOW compared to gold prices – the ratio is at the low end of its 27 year trend channel and likely to rise.
- Silver prices fall faster and rally more rapidly than gold prices. When the price of silver finally takes off it will push the ratio much higher – perhaps to 0.03 or 0.04 – the equivalent of a gold-to-silver ratio of 33 to 25.
- Many other indications (not shown here) also suggest silver is too low, over-sold, and ready to rally. The same is true for gold.
Investor demand for silver and gold bars and coins is strong and increasing. I think silver and gold prices will be higher by the end of 2014 and much higher by the next US presidential election.
The pieces of paper we mistakenly call money will become less valuable in the years ahead. Take this opportunity to convert some paper currency to physical silver while the High Frequency Traders and central bankers are gifting us with artificially low silver and gold prices.
You might also find value in:
Silver Was Not in a Bubble in 2011!
Silver in the Dead Zone of Disinterest
GE Christenson aka Deviant Investor If you would like to be updated on new blog posts, please subscribe to my RSS Feed or e-mail
© 2014 Copyright Deviant Investor - All Rights Reserved Disclaimer: The above is a matter of opinion provided for general information purposes only and is not intended as investment advice. Information and analysis above are derived from sources and utilising methods believed to be reliable, but we cannot accept responsibility for any losses you may incur as a result of this analysis. Individuals should consult with their personal financial advisors.
© 2005-2022 http://www.MarketOracle.co.uk - The Market Oracle is a FREE Daily Financial Markets Analysis & Forecasting online publication.