Indian Stocks: You Want a REAL Opportunity? Know WHEN to Look for It
Stock-Markets / India May 24, 2014 - 01:52 PM GMTBy: EWI
 Why the Nifty and many other emerging market stocks screamed "Buy!" three months ago
From Elliott Wave International's February Asian-Pacific Financial Forecast (published Feb. 7):
...Bloomberg reports that "more than $7 billion flowed from ETFs investing in developing-nation assets in January, the most since the securities were created." Such massive selling...supports our view that emerging markets are ending large-degree three-wave declines.
Conventional observers are asking the question, "Is this 1997 all over again?" (The Economist)
The way we see it, the return of such headlines in January supports another significant low now -- from a contrarian perspective.
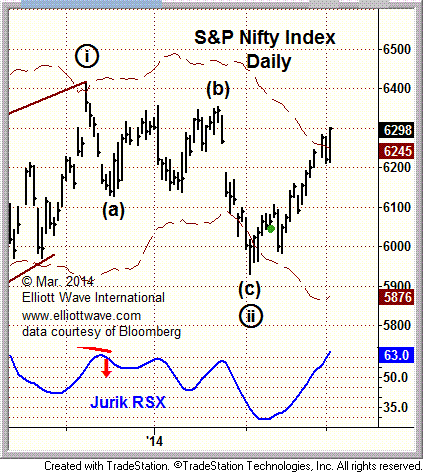
EWI's Asian-Pacific Short Term Update editor Chris Carolan soon echoed those bullish views. Here is a forecast the APSTU made for India's Nifty Index on March 4:

The strong short-term Nifty rally has pushed prices above their upper daily Keltner channel resistance level.
Look for this [rally] up to push through the 2014 highs at 6400 in coming sessions.
The intraday Keltner channel slope is steep, indicating this trend has enough strength for sharp short-term gains.
You've already picked up on the indicators we used to turn bullish on emerging markets in general, and on India in particular:
- A bottoming Elliott wave pattern - and a start of a strong Elliott wave rally
- A bearish market sentiment extreme towards Indian stocks, evident by the panicky headlines in January-February, plus big capital outflows from emerging market ETFs
- The fact that the Nifty broke above a key trend channel. See those two dotted lines in the chart above? That's the Keltner channel*, a very effective trend-defining tool.
As Indian stocks progressed higher, on March 9 Chris Carolan updated his bullish forecast and added this comment about India's upcoming elections:
Bloomberg reports that the Nifty's rise to new all-time highs on [March 7] occurred "amid speculation the opposition Bharatiya Janata Party is gaining support before general elections that start next month."
But from the perspective of the Wave Principle, the index's strong advance was a textbook bullish breakout in a third-of-a-third wave advance.
Volume hit its highest level in over a year. Momentum did as well, which suggests that the day's advance was part of a third wave. The weekly Keltner channel lies almost four percent above current levels, which also supports clear sailing in the short term.
Conventional analysts can rationalize the rally any way they want, but India's...bull market will continue no matter which party wins the elections.
By the end of March, Indian stocks shot up 10%.
Then in April, the Nifty added another 4.9%.
And just this week -- the week of the elections -- both the Nifty and the Sensex hit new all-time highs.
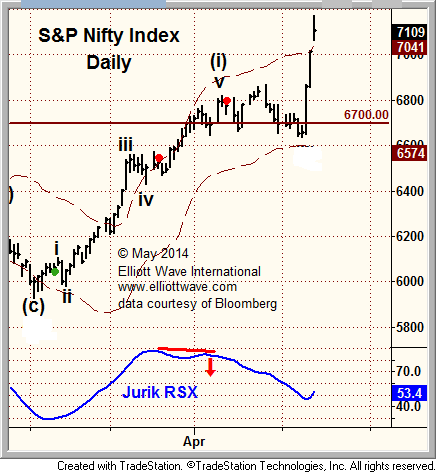
Now, Chris Carolan says this in the May 13 Asian-Pacific Short Term Update (partial wave labels shown):

The Nifty is up 6.7% in three trading sessions...
Risk management is a never-ending task. It's always a good idea to reduce exposure when markets move dramatically.
We have to remain prepared for any outcome.
Chris Carolan is a recipient of the Charles H. Dow Award from the Market Technicians Association. He has his own unique way of looking at European and Asian-Pacific markets that is beneficial for investors and traders alike. Chris will be hosting a free webinar on May 29 where he will share some of his insights into these markets. See below for more details.
Do You Want to Be Prepared to Capture New Trends? Then join EWI's European and Asian-Pacific Short Term Update editor Chris Carolan, FREE, for a live webinar on May 29: "3 Effective Tools for Navigating International Markets" You will walk away knowing how you can use these 3 tools to forecast markets you invest in:
Go ahead, grab your free virtual seat at this May 29 webinar now. |
This article was syndicated by Elliott Wave International and was originally published under the headline Indian Stocks: You Want a REAL Opportunity? Know WHEN to Look for It. EWI is the world's largest market forecasting firm. Its staff of full-time analysts led by Chartered Market Technician Robert Prechter provides 24-hour-a-day market analysis to institutional and private investors around the world.
Founded in 1979 by Robert R. Prechter Jr., Elliott Wave International (EWI) is the world's largest market forecasting firm. Its staff of full-time analysts provides 24-hour-a-day market analysis to institutional and private investors around the world.
© 2005-2022 http://www.MarketOracle.co.uk - The Market Oracle is a FREE Daily Financial Markets Analysis & Forecasting online publication.


.gif)