Gold Price Shaping Up for the Next Plunge
Commodities / Gold and Silver 2014 May 22, 2014 - 05:48 PM GMTBy: Submissions
 Austin Galt writes: I always begin my analysis by looking at the big picture to determine what is the overall trend and where we are in that trend. That means starting by looking at the yearly chart. I also like to keep my charts simple so things aren’t too confusing and I don’t start jumping at shadows.
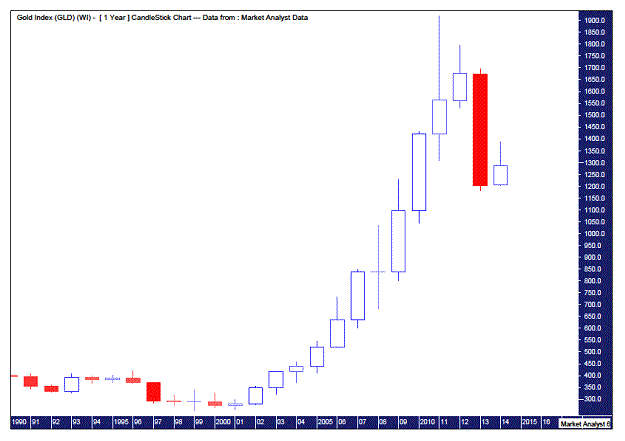
YEARLY CHART

Here we can see that gold has just experienced a bull market lasting 10 continuous years. Is it any wonder that perhaps a pullback was needed? So we currently appear to be still in a correction within a long term structural bull market. The bulls need not fret as this correction is healthy and will provide a strong foundation from which to launch its next offensive in the years to come which, in my opinion, should see the price whoosh past US$5000.
Now let’s take a look at the monthly chart to get a bit more detail.
MONTHLY CHART

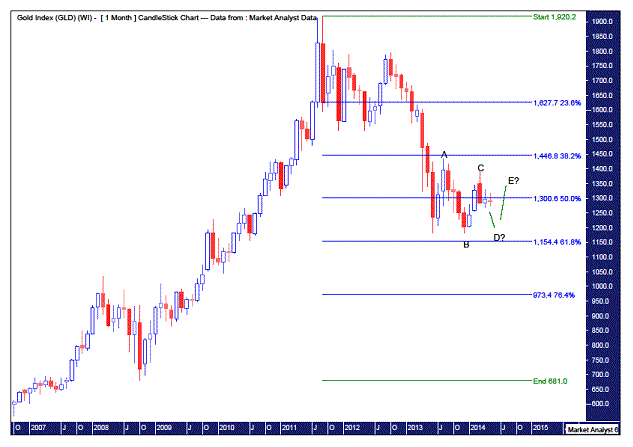
The monthly shows that a downtrend is currently in force. We can see a double bottom has formed around US$1180. While the amateurs can be heard jumping up and down shouting “Double bottom! Double bottom!” as if it’s the holy grail, one thing I have learnt is that double bottoms and tops rarely end trends. Sure they are great for traders who can play the reactions but once done the underlying trend will return, in this case a downtrend.
As an aside, the double bottoms and tops that are powerful are those that are with the trend - ie/double bottoms in an uptrend and double tops in a downtrend. In fact there is an example of just that in the monthly gold chart. A double top, or triple top even, appears at the $1800 level which has formed after the all time top has been set. This led to a powerful decline.
From an Elliott Wave perspective, which I don’t like to get too wrapped up in, the double bottom appears to be part of a corrective ABC structure. The C point looks to be the recent top in March at US$1390 and unless that level is surpassed it is my view that the next leg down is underway which should see the double bottom smashed in the near future. The corrective pattern may or may not include a D and E point which would just prolong the duration of the correction.
WEEKLY CHART

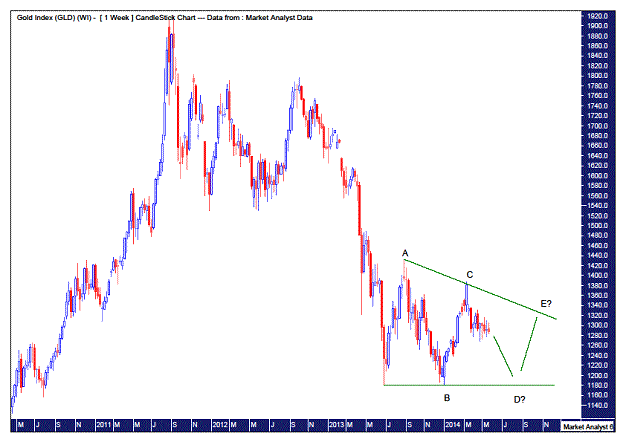
The weekly chart just lets us look up close and personal at the current structure unfolding. The A, B and C points are clearly defined and look to be part of a bearish consolidation pattern. My personal opinion is there is still a bit more backing and filling to be done which would give rise to a D and E point. There is a good chance the D point will make a triple bottom. Then once the E point has formed price should then come down and bust the US$1180 support on the 4th attempt. The 4th attempt at support or resistance is generally successful. Failure to bust support then would be a very bullish sign but I highly doubt that scenario.
Looking further out in an attempt to predict the end of this major correction from the top, we can see the last meaningful top before the all time top was that in 2008 at US$1034. Old tops often act as support in the future but experience has shown me that price often dips a bit below these support levels.
I have also put up some Fibonacci retracement levels of the upleg from the 2008 low to 2011 high. While many chartists focus on the popular Fib level of 61.8% I often find that once that level is broken they give up forgetting the oft forgotten 76.4% level. In this case that sits around US$973. Also, one of Gann’s teachings is that the low price is often 50% of the high price, in this case US$960 (being 50% of the US$1920 high). These levels sit conveniently below the important psychological level of US$1000 and if that level is broken then the gold permabulls will go weak at the knees, their hopes crushed – just the signal that the correction will be over!
Bio
I have studied charts for over 20 years and currently am a private trader. Several years ago I worked as a licensed advisor with a well known Australian stock broker. While there was an abundance of fundamental analysts there seemed to be a dearth of technical analysts, at least ones that had a reasonable idea of things. So my aim here is to provide my view of technical analysis that is both intriguing and misunderstood by many. I like to refer to it as the black magic of stock market analysis.
I am available to be a paid contributor for a reputable outfit. Contact austingalt@hotmail.com
© 2014 Copyright Austin Galt - All Rights Reserved
Disclaimer: The above is a matter of opinion provided for general information purposes only and is not intended as investment advice. Information and analysis above are derived from sources and utilising methods believed to be reliable, but we cannot accept responsibility for any losses you may incur as a result of this analysis. Individuals should consult with their personal financial advisors.
© 2005-2022 http://www.MarketOracle.co.uk - The Market Oracle is a FREE Daily Financial Markets Analysis & Forecasting online publication.


