


Stock Market Chartology Mania
Stock-Markets / Stock Markets 2014 May 22, 2014 - 07:36 AM GMT

 First I want to acknowledge how frustrating the markets have been over the last several months for most of you. There has been no clear cut trend in which one can just take a position and not get caught up in the chopping action the markets have been giving us. As I have said in the past the hardest part of trading is to get your initial position to stick before your sell/stop gets hit. If your a bear it’s two steps down and one step up and if your a bull it’s two steps forward and one step back. It’s that one step after you take your initial position that usually gets you if you don’t buy the exact high or low.
As of right now there is nothing broken in any of our portfolios as the consolidation patterns keep in building out. This is the frustration that most of you are feeling right now as there is no direction, one day up and the next day down. This is the how markets work. They will frustrate you until you can’t stand it anymore then you will sell out to save your sanity. Believe me there is nothing wrong with saving ones sanity as that is the most important feature for playing in the markets. The markets are hard enough to play when your sane but impossible if your emotions get in the way. I wish I had a magic wand I could wave to make it all better but I don’t and I don’t know anyone that does. So the game goes on until one side wins the battle and then we get a move we can actually hold onto for awhile.
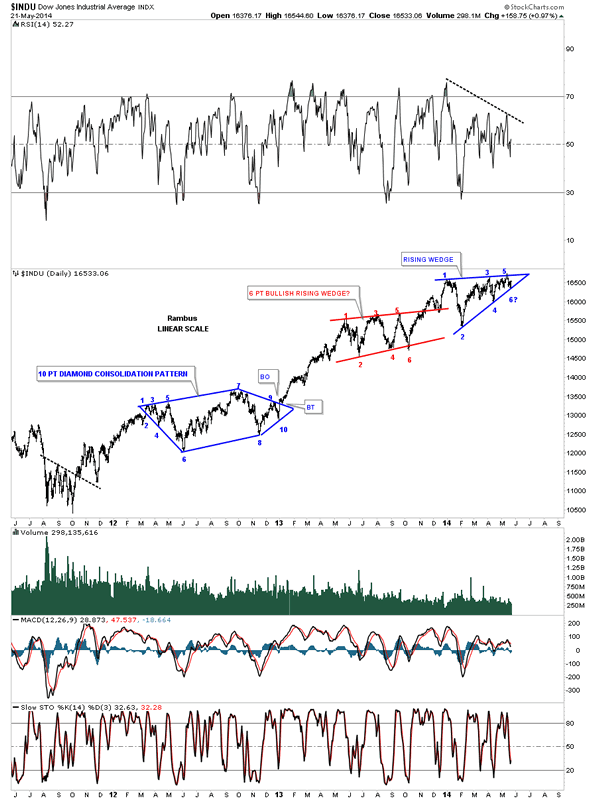
Lets start with a daily chart for the Dow Jones that has been consolidation or topping since the first of the year. It has completed 5 reversal points so far making it a reversal pattern at this time. The only problem is the price action bouncing off the bottom rail that could be a 6th reversal point if the price reaches the top rail. At that point it would be a consolidation pattern if it was to break through the top rail of the rising wedge. As of this moment the rising wedge is a reversal pattern because it has completed 5 reversal points so that is what we have to go on until something changes.
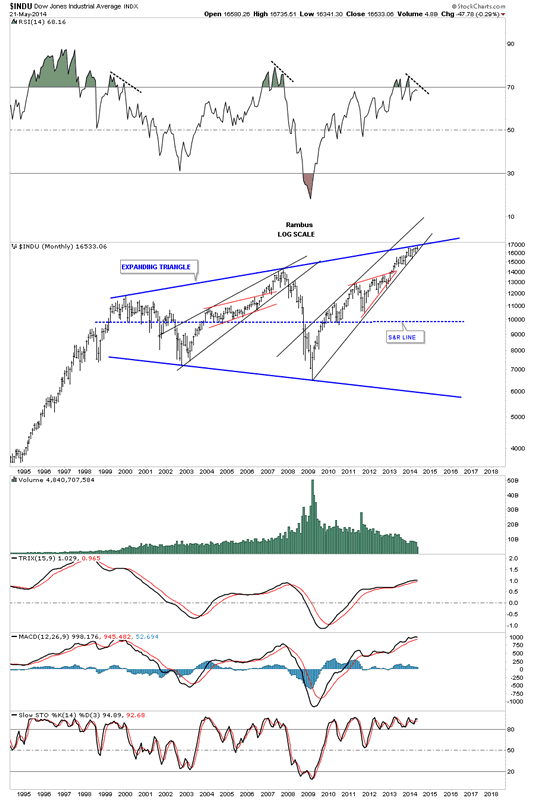
This very long term monthly chart for the Dow shows it’s trading at the top blue rail of a huge expanding triangle that starts back in 2000. As you can see the price action is squeezing right into the apex of the top blue rail of the expanding triangle and the bottom rail of the rising wedge. This is either a great shorting opportunity or if the price action can break above the top rail of the massive blue expanding triangle, a great buy. The jury is still out on this one yet.
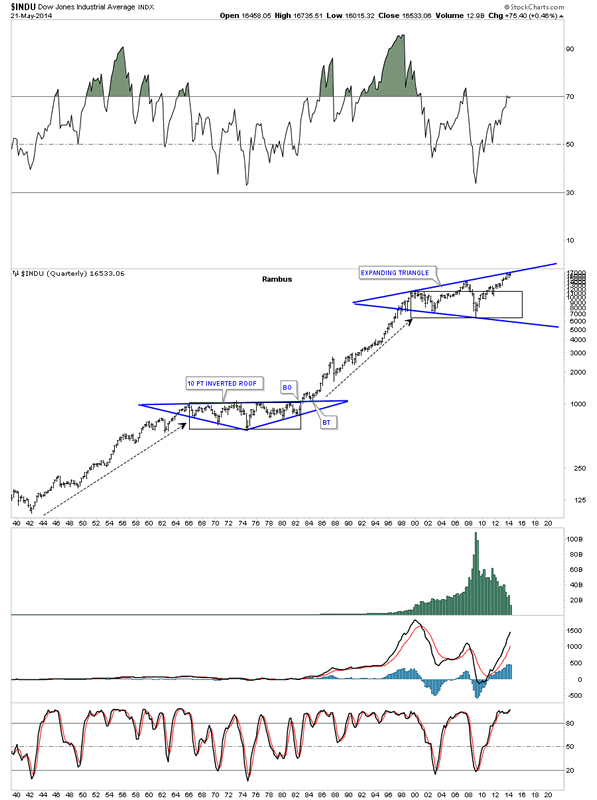
Below is a very long term chart for the Dow that goes all the way back to the 40′s. You can see the inverted roof pattern that formed during the big bear market of the 70′s. This chart does a good job of showing how an impulse move, on any time scale, plays out. Note the secular bull market that started in the early 40′s and ran all the way up to 1966 where the secular bear market began. You can see how long it took to work off the bull market run, black rectangle, before the Dow was ready for the next major impulse move higher that would take it to the 2000 top where our current consolation pattern is forming. The million dollar question we have to ask ourselves is the blue expanding triangle finishing up with the 14 year consolidation pattern or is there still more work that needs to be done to work off the excesses from the previous secular bull market? Again you can see how critically important the price action is that is trading at the top blue rail of the 14 year consolidation pattern.
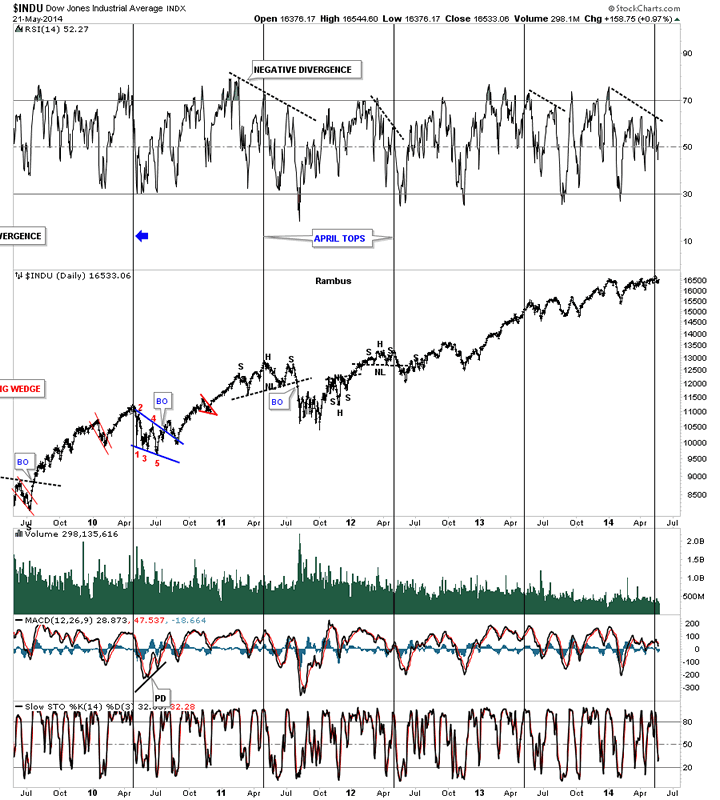
Below is a 5 year chart of the Dow that shows an important intermediate term top was made in April of each year. Will this year be any different?
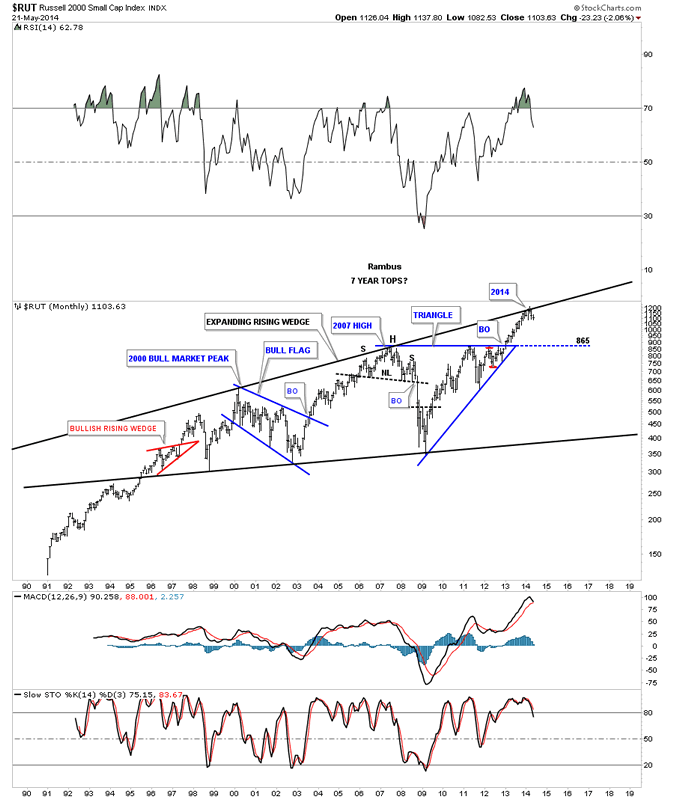
Lets now take a look at the Russel 2000 that is trading up to the top blue rail of its expanding rising wedge formation. As you can see there was a top in 2000, then seven years later another top in 2007 and now we are at the top rail seven years later in 2014. I don’t want to sound like a broken record but this area does look like a good place to try a short trade. As we know there are no guarantees. If we do see a correction I would expect the first line of support to come in around the previous tops at 865 or so.
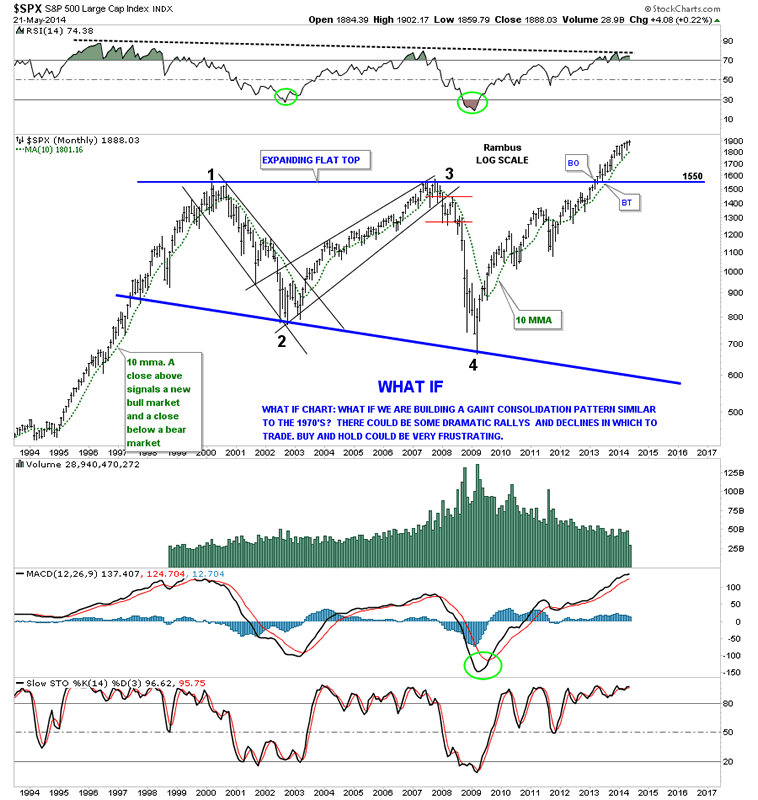
Of all of the stock market indexes the SPX has the most bullish look to it as it has already broken out of its expanding flat top triangle. The only thing lacking to make this chart super bullish is there is no backtest yet. A backtest down to the 1550 area, the old highs, would be a great buying opportunity if the SPX does a backtest.
The monthly chart for the SPX shows its been trading in a rising wedge formation since the bear market low in 2009. There is also a bit of a negative divergence taking place similar to the 2000 and 2007 tops.
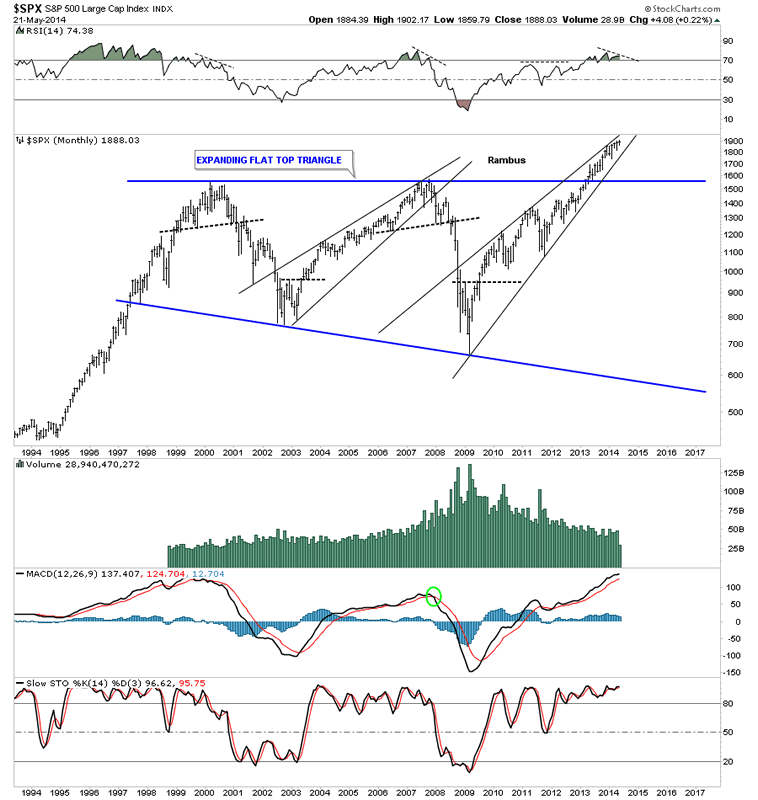
The quarterly chart for the SPX shows it has broken out of its expanding flat top triangle but no backtest so far. As you can see in the 70′s bear market the SPX did have a clean breakout and backtest before it started its secular bull market.

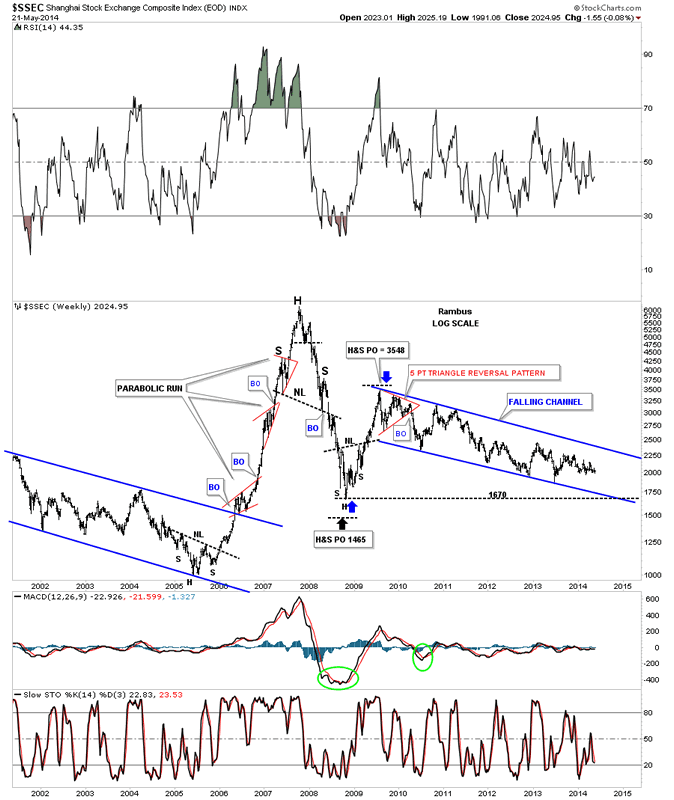
A lot of folks believe China is the cure all for just about everything out there. If China gets moving to the upside commodities will be soaring once again. China is supposed to be buying up all the available gold out there that should be bullish for the price of gold. As you can see on this chart below China has been in the doldrums since it put in its parabolic run in 2007. This is exactly how a stock looks after a parabolic blow off phase. After the initial decline from the parabolic top the SSEC had a counter trend rally back up to 3548 where it has been drifting lower for more than 5 years. There is nothing bullish about this chart.
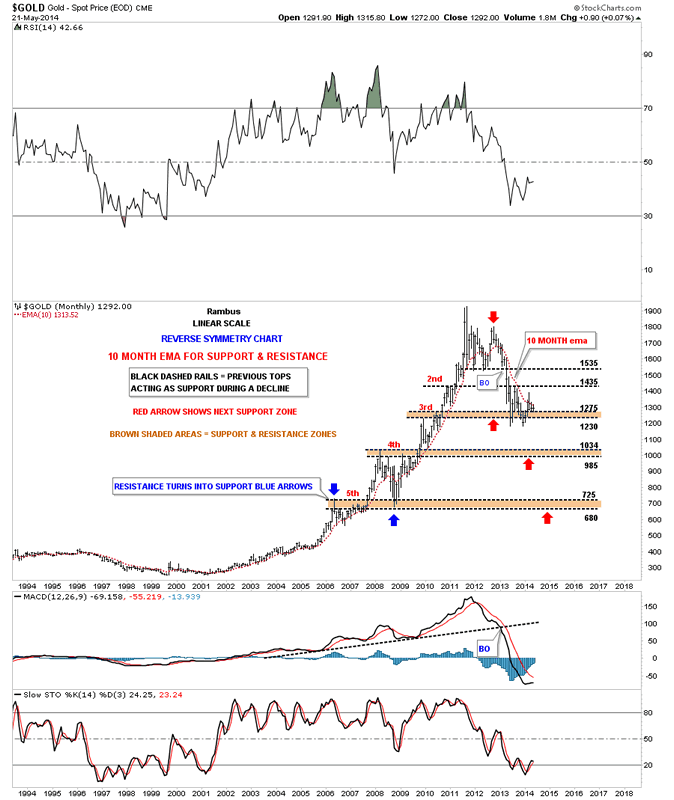
Does gold share the same fate as the SSEC after its parabolic run?
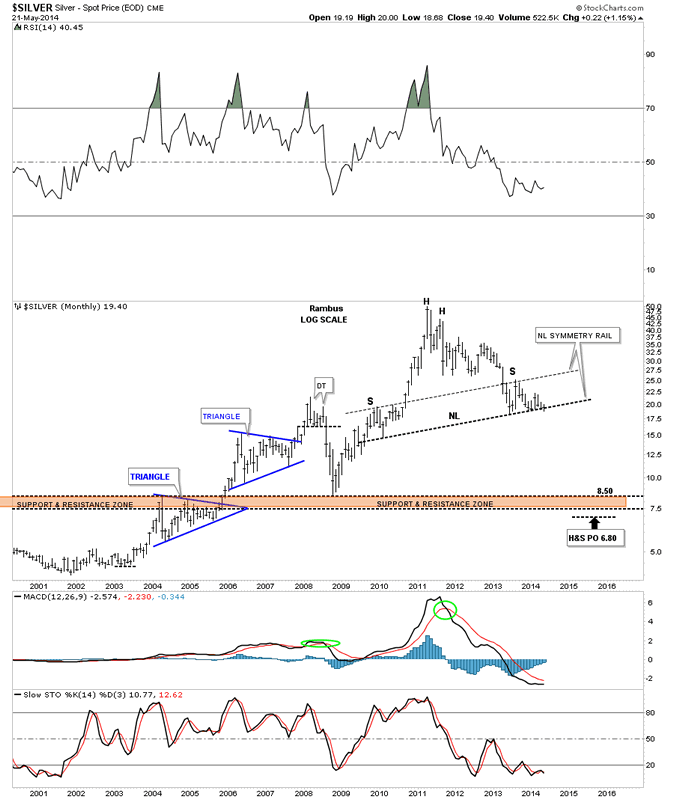
The last chart for tonight is the long term look at silver that we’ve been following for sometime now. Part of the frustration you are feeling with silver is the major support rail its been testing that has a good chance to be a neckline of a major H&S top. Big important trendlines like that don’t give up easily. As you can see this month of May has cracked the neckline but not decisively yet. There is still a week and a half of trading yet before this monthly chart shows the closing price. This is either the best buying opportunity or the greatest short of a lifetime right here and now. You know how I’m positioned. All the best…Rambus
All the best
Gary (for Rambus Chartology)
FREE TRIAL - http://rambus1.com/?page_id=10
© 2014 Copyright Rambus- All Rights Reserved
Disclaimer: The above is a matter of opinion provided for general information purposes only and is not intended as investment advice. Information and analysis above are derived from sources and utilising methods believed to be reliable, but we cannot accept responsibility for any losses you may incur as a result of this analysis. Individuals should consult with their personal financial advisors.
© 2005-2022 http://www.MarketOracle.co.uk - The Market Oracle is a FREE Daily Financial Markets Analysis & Forecasting online publication.