Stock Market New High and the Lindsay Forecast
Stock-Markets / Cycles Analysis May 20, 2014 - 10:48 AM GMTBy: Ed_Carlson
 Last week's new high in the Dow puts the Lindsay forecast into flux. Long time readers know that the advance from the 2011 Sideways Movement was long ago recognized to be the fly in the ointment for forecasting the end of the bull market.
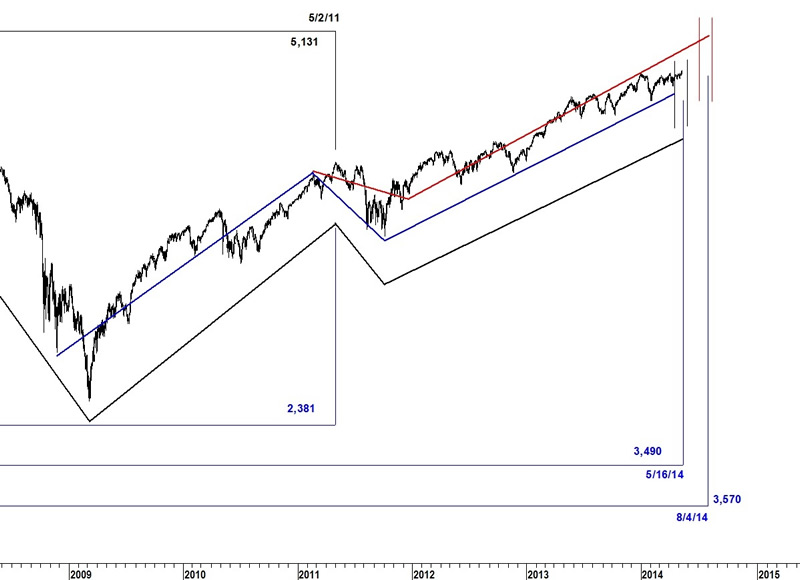
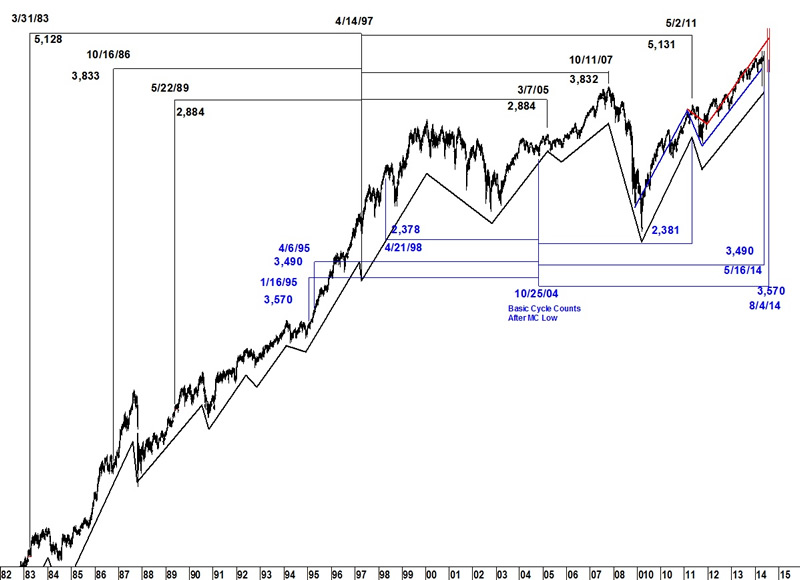
Quick Review: Sideways Movements (when the basic advance is unable to reach the time span of the 15year interval) are almost always topping formations. Lindsay identified only two instances (over the course of 200 years) which saw advances from this pattern, rather than declines, and this was seen again in 2011. The challenge is in knowing from where to count the next basic advance. After much vacillating, it was decided to count the current basic advance from the low on 12/19/11 due to the description Lindsay gave of the 1926 pattern.
A long basic advance (742-830 days) from 12/19/11 expired on 3/28/14. Last week's new highs disqualifies that count and opens the door for the bull market to become an extended basic advance (929-968 days). That makes the period from July 5 until August 13 the expected kill zone for the bull. All this assumes that 12/19/11 is the correct origin of the basic advance. But what if it's not?
A review of the Sideways Movement in 1880 is complicated by the fact that Lindsay constructed his own index for the 1798-1897 time period and the only record is a hand drawn copy he left in his paper An Aid to Timing. While the reproduction is actually quite impressive given it was hand drawn, he failed to label exact dates; it appears to be a monthly chart. In reading his description, and reviewing the chart, it looks like he may have counted from the low of the basic cycle that time. If we were to count the current basic advance from the low of the basic cycle this time, we would count from the low on 10/4/11.
Counting from 10/4/11 means the basic advance has already become extended. An extended basic advance targets the period for a top from 4/20/14 to 5/29/14. With a Middle Section forecast pointing to a high between Tuesday and Friday last week, this would seemingly be the end of the bull market (if counting from the 10/4/11 low is correct). There are no other Middle Section counts pointing to a high within the April-May time frame.
Figure 1

Figure 2

Download your free copy of An Introduction to Lindsay at Seattle Technical Advisors.
Ed Carlson, author of George Lindsay and the Art of Technical Analysis, and his new book, George Lindsay's An Aid to Timing is an independent trader, consultant, and Chartered Market Technician (CMT) based in Seattle. Carlson manages the website Seattle Technical Advisors.com, where he publishes daily and weekly commentary. He spent twenty years as a stockbroker and holds an M.B.A. from Wichita State University.
© 2014 Copyright Ed Carlson - All Rights Reserved
Disclaimer: The above is a matter of opinion provided for general information purposes only and is not intended as investment advice. Information and analysis above are derived from sources and utilising methods believed to be reliable, but we cannot accept responsibility for any losses you may incur as a result of this analysis. Individuals should consult with their personal financial advisors.
© 2005-2022 http://www.MarketOracle.co.uk - The Market Oracle is a FREE Daily Financial Markets Analysis & Forecasting online publication.


