


Silver Was Not In a Bubble in 2011!
Commodities / Gold and Silver 2014 May 14, 2014 - 03:25 PM GMTBy: DeviantInvestor

 Conclusions
- The April 2011 silver price spike was NOT a bubble.
- The January 1980 silver price blow-off was a bubble, and it was materially different from the April 2011 price spike.
- I fully expect a bubble in silver – someday – but that day is months or years into the future.
- Prices for food, energy, silver, and gold are going up – broadly speaking – along with the national debt, money supply, and similar measures of debt and credit. Since we KNOW national debt will increase for the foreseeable future, plan on the prices for food, energy, silver, and gold increasing similarly.

The Data
- I examined the weekly data for silver since 1974.
- I used 144 week, 100 week, and 40 week moving averages for smoothing.
- I calculated the difference, both absolute and as a percentage, of the weekly closing price of silver above and below the various moving averages.
- Excel calculated the standard deviation of the percentage price differences in the various data sets – over 2000 data points for each of the three moving average groups.
- I examined the exceptions – the extremes in the data sets.
Data Results
Using the 144 week moving average data, the peak (weekly closing data) in early 1980 was 10.4 standard deviations above the norm. The April 2011 peak was 4.12 standard deviations above the norm. The current price for May 2014 is about 0.75 standard deviations BELOW the norm. Current 144 week moving average of the weekly silver closes is about $27.50. One standard deviation is approximately 39% of the 144 week moving average.
You may object to such a long moving average and think it exaggerated the number of standard deviations above the norm that occurred in 1980. Nope! The results were similar, regardless of the length of the moving average. The 1980 peak was 10.39 standard deviations above the norm using 100 week moving average, and 9.66 standard deviations above the norm using the 40 week moving average. Using the 40 week moving average the April 2011 peak was less than 4 standard deviations above the norm. April 2011 was NOT a bubble peak and was merely a spike high that will be repeated sometime in the next few years.
Yes, I know that 10 standard deviations occurs with an infinitesimally small probability, assuming a normal distribution of statistical data. But most of us know that market data cannot be represented as a normal distribution at the extremes of the data – there are “fat tails” where the extremes occur far more often than a normal distribution would indicate. Real world examples – such as rogue waves off the southern coast of South America – are observed, relatively speaking, much more often than a normal distribution would predict. I have read that the interest rate spreads that sunk Long Term Capital Management in 1998 “should” have occurred less than once in the known age of the universe – assuming a normal statistical distribution.
The important point, in my opinion, is that the bubble peak in 1980 was thousands of times more extreme and LESS probable than the price spike in April 2011, which was not, in my analysis, a blow-off bubble. Hence I expect that silver prices, along with national debt, congressional spending, health care expenses, and bankster graft and corruption, will increase substantially from here. Expect the blow-off bubble peak in silver and gold in a few years. Expect the current bubbles in sovereign debt, “printing money,” and fiat currencies to pop at some time in the relatively near future.
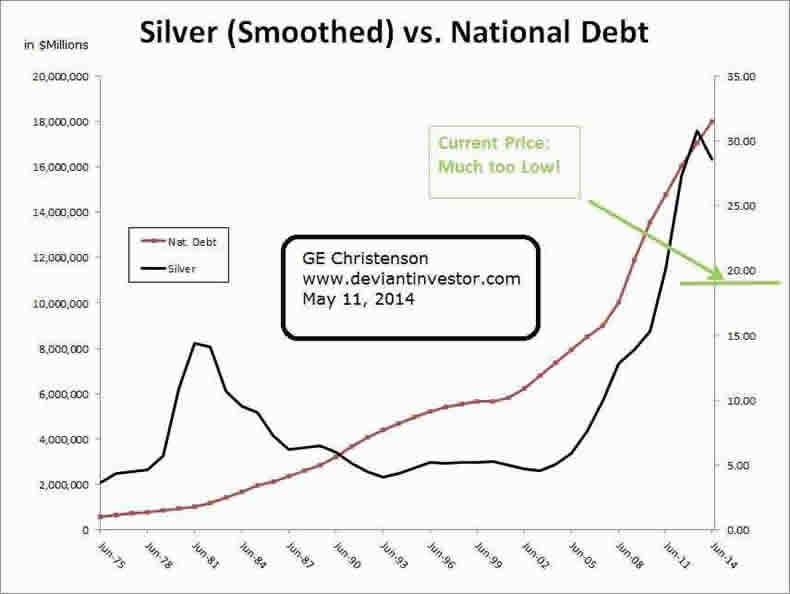
The following graph of smoothed silver prices correlates with national debt at about 0.75. Correlation is not causation, but massive deficits create a continually increasing national debt and that causes the money supply to increase. That “printed money” works its way into the economy causing higher prices. Every family knows food prices have increased, gasoline is nearly triple what it was 15 years ago, and, not surprisingly, the prices for silver and gold are also much higher. They are all connected.
The bubble in silver and gold is coming – it did not occur in 2011. Expect stormy weather and higher silver and gold prices ahead. When? Ask the High-Frequency-Traders, JP Morgan, the Treasury department, or just wait for demand to overwhelm physical supply in the relatively near future.
You might also find value in:
- Silver, Gold, and What Could Go Wrong
- Silver Up & S&P Down
- DI’s Interview on the Financial Survival Network
GE Christenson aka Deviant Investor If you would like to be updated on new blog posts, please subscribe to my RSS Feed or e-mail
© 2014 Copyright Deviant Investor - All Rights Reserved Disclaimer: The above is a matter of opinion provided for general information purposes only and is not intended as investment advice. Information and analysis above are derived from sources and utilising methods believed to be reliable, but we cannot accept responsibility for any losses you may incur as a result of this analysis. Individuals should consult with their personal financial advisors.
© 2005-2022 http://www.MarketOracle.co.uk - The Market Oracle is a FREE Daily Financial Markets Analysis & Forecasting online publication.