


This 13th Century Mathematics Tool Can Make You Serious Money Today
InvestorEducation / Technical Analysis May 14, 2014 - 12:12 PM GMTBy: Money_Morning

 Keith Fitz-Gerald writes: Every once in a while I like to circle back to some of the great questions I get from you.
Today, I want to dive into one from Suzanne P., who wants to know if "Fibos" can help her make money in the markets.
In a word, yes. But, you've got to understand what "Fibo" analysis is and how it works to make it profitable....
The Mathematical Sequence That Shows Up Everywhere
"Fibo" is short for Fibonacci - as in, Leonardo Fibonacci. Born in Pisa, Italy, around 1170, he's considered by many to be the single most influential western mathematician of the Middle Ages. His 1202 book, Liber Abaci ("Book of Calculation"), remains instrumental to our understanding of mathematics to this day and is filled with examples that applied to money-changing, interest calculation, and commercial bookkeeping, for example.
Today we know Leonardo simply as "Fibonacci," which is same name given to a numerical series in his book that he did not discover but that he used as an example. Despite their reputation as being difficult or complex, in reality, Fibonacci numbers are easy to learn and easy to understand.
The sequence, if you're counting, looks like this... 1 1 2 3 5 8 13 21 34 55 and so on.
Right away you can see a pattern. One plus one equals two. One plus two equals three. Two plus three equals five. And so on.
But if you look closer, something else emerges. Every number in the series is approximately 0.618-to-1 in terms of its relationship to the number after it. This ratio never changes because the proportion remains the same.
This is important so don't lose that thought; we're going to come back to it in a minute.
What's simply amazing to me is that Fibonacci (and lots of scientists after him) have found Fibonacci numbers in nature. For example, the number of petals on flowers is often a Fibonacci number, as are the number of "cells" in a pineapple's skin. Pinecones, sunflowers, beehives... they all display Fibonacci's numbers or sequence in some way.
More amazingly, plant leaves are often arranged in spirals or shapes that, when counted, are found to be adjacent Fibonacci numbers. In fact, if you divide the arc they form along a vine, for example, the arc length angle ratio is equal to 137.5 degrees. The numbers are so consistent that the relationship is actually called the "Golden Ratio" or the "Golden Mean."
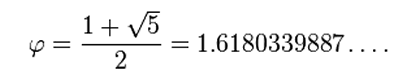
Mathematically, it looks like this, where the Greek letter phi represents the golden ratio:
Geometrically, if you draw it out, the Fibonacci ratio or "Golden Mean," if you prefer, looks like this... 
These relationships can be found all over the place in the natural world in everything from dolphins' fin sections to the ratio between human forearms and hands. Even the cochlea in our inner ear is a "golden" spiral adhering to this set of proportions.
Fibonacci numbers and ratios can also be found - you guessed it - in the stock market.
Fibo and Equities
Admittedly, a lot of people have problems coming to terms with this. The data is a dubious fit, they say. Or, the computerization makes a natural order impossible, they challenge.

I disagree. The stock market represents the combined inputs and decision making of millions of participants at once. That means it is more like a living, breathing system than a static one. So while computers may temporarily change things, the natural order of human decision making is still very much a part of how markets work. Which means you can use the Golden Mean and the Fibonacci sequence to analyze them if you know what you are doing.
For example, you can apply Fibonacci numbers to include range and retracement like this using a common tool known as the Fibonacci Arc, seen here on the right.
Notice how price tends to move from one key "Fibonacci" level to another, especially when it comes to spotting likely reversals or breakdowns.
 The Fibonacci sequence can also be applied to time, as at left. I particularly like this type of Fibonacci analysis because knowing how time passes can help me understand whether trends are likely to continue or falter.
By the way, most online trading packages and analytics now include drawing tools based on the Fibonacci series. So even if you are mathematically challenged like I am, you can still harness the power inherent in the numbers.
Start by "anchoring" on a recent major swing high or low if you're a day trader. If you're an investor with a multi-year perspective, I think a major market turning point is more appropriate.
Then, extend the Fibonacci ratio or tool to subsequent turning points. What you are looking for is the "fit" between properly scaled charts and the Fibonacci tool you are using - be it arcs, lines, or ratios, for example.
You'll know you have it when prices line up along key lines and intervals. Then you can look to what traders call the "hard right edge" or the last data point you have available and predict likely future turning points and market trends, as well as potential breakouts and key reversal levels, even though they haven't happened yet - often with remarkable accuracy.
This, in turn, gives you an edge because you can be "on guard" for market movements that will take others by surprise.
Let me show you...
The Predictive Power of Fibonacci

The 57 % decline from October 2007 highs to March 2009 lows established an analytical anchor for the rally that built all the way to April 2010 when the markets had their first hiccup. Not coincidentally, the S&P 500 Index tacked on 83% over 13 months covering - drum roll, please - approximately 61.8% of the distances from the 2007 peak to the March 2009 low.
What's more, Fibonacci analysis suggested that the pullback would peter out around 1010 despite the fact that millions of investors thought we were one leg away from another financial apocolypse. In fact, it held at 1,008, which is almost smack on the 38.2% Fibonacci retracement level suggested by the Fibonacci series and, in turn, the converse of the Golden Ratio.
Subsequently, the index reversed and marched higher through May 2011, peaking just shy of the 78.6% before falling again to its next logical retracement level of 50% before taking off in earnest to where we are today.
Obviously there is an element of subjective interpretation here, but you cannot deny the fact that Fibonacci analysis helped investors identify each of these important market turning points months in advance.
This stuff is so good that I like to joke that if you put 5 Fibonacci practioniers in a room you will get 10 opinions about where the markets are headed.
All joking aside, though, no two investors have the same time frame or risk tolerances. So the fact that there is a difference in opinion is vindication that Fibonacci numbers can help you spot opportunities others don't see.
My good friend, Tom Gentile, agrees. Tom, who co-founded Optionetics, is one of the world's leading Fibonacci practioners. He believes "that there's definitely something there," which is why he uses both the Fibonacci ratio and the Golden Mean to pick entry prices and profit targets as part of his trading routine and as a complement to other analysis.
Knowing what I've just explained, you now have the power to do the same thing.
At the end of the day, there is no "Holy Grail," but the fact that an 800-year-old indicator works just as well today as it did centuries ago means there could be.
From the Editor: Do you have a question for Keith to address in a future "Marketology" column? E-mail him at customerservice@moneymorning.com and ask away. He'd love to hear from you.
Source : http://moneymorning.com/2014/05/14/this-13th-century-tool-can-make-you-serious-money-today/
Money Morning/The Money Map Report
©2014 Monument Street Publishing. All Rights Reserved. Protected by copyright laws of the United States and international treaties. Any reproduction, copying, or redistribution (electronic or otherwise, including on the world wide web), of content from this website, in whole or in part, is strictly prohibited without the express written permission of Monument Street Publishing. 105 West Monument Street, Baltimore MD 21201, Email: customerservice@moneymorning.com
Disclaimer: Nothing published by Money Morning should be considered personalized investment advice. Although our employees may answer your general customer service questions, they are not licensed under securities laws to address your particular investment situation. No communication by our employees to you should be deemed as personalized investent advice. We expressly forbid our writers from having a financial interest in any security recommended to our readers. All of our employees and agents must wait 24 hours after on-line publication, or after the mailing of printed-only publication prior to following an initial recommendation. Any investments recommended by Money Morning should be made only after consulting with your investment advisor and only after reviewing the prospectus or financial statements of the company.
Money Morning Archive |
© 2005-2022 http://www.MarketOracle.co.uk - The Market Oracle is a FREE Daily Financial Markets Analysis & Forecasting online publication.