


U.S. Dollar 15-Year Cycle Decline Should Favor Gold
Commodities / Gold and Silver 2014 May 13, 2014 - 03:31 PM GMTBy: Trader_MC

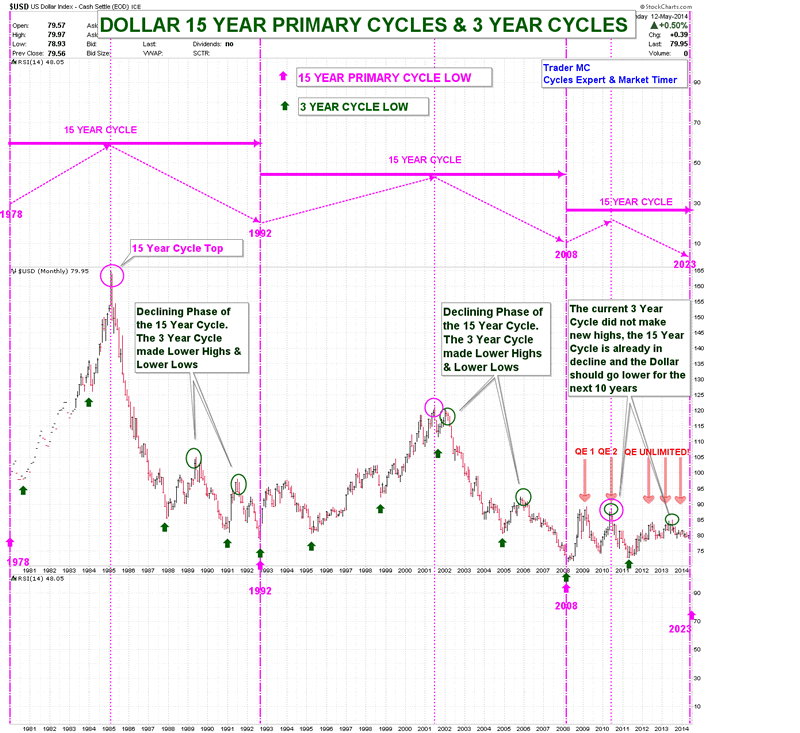
 The Dollar is following an accurate 15-Year Cycle which is made of five 3-Year Cycles. On the following chart you can see that we are currently in the 15-Year Cycle that began in 2008. The current 3-Year Cycle that began in 2011 did not make new highs above the previous 3-Year Cycle that began in 2008 which puts the 15-Year Cycle in decline. As a result the current 15-Year Cycle has probably already topped and the following 3-Year Cycles should make lower highs and lower lows. The Dollar Index should therefore decline during the next ten years until the next 15-Year Cycle Low due in 2023.
The current 15-Year Cycle topped in 2010, only two years after it began in 2008. It is the first time that the primary 15-year Cycle topped so early as the primary 15-Year Cycle from 1978 topped seven years later in 1995 and the 15-Year Cycle from 1992 topped eight years later in 2001. This shows that the debasement of the Dollar is strongly accelerating with the Fed quantitative easing policy and the massive debt accumulation. The 15-Year Declining Cycle means that a sharp drop in the value of the Dollar will continue in the coming years and the U.S. government debt needs to be monetized as no one will buy it except the Fed.
Dollar 15 Year Cycles Chart
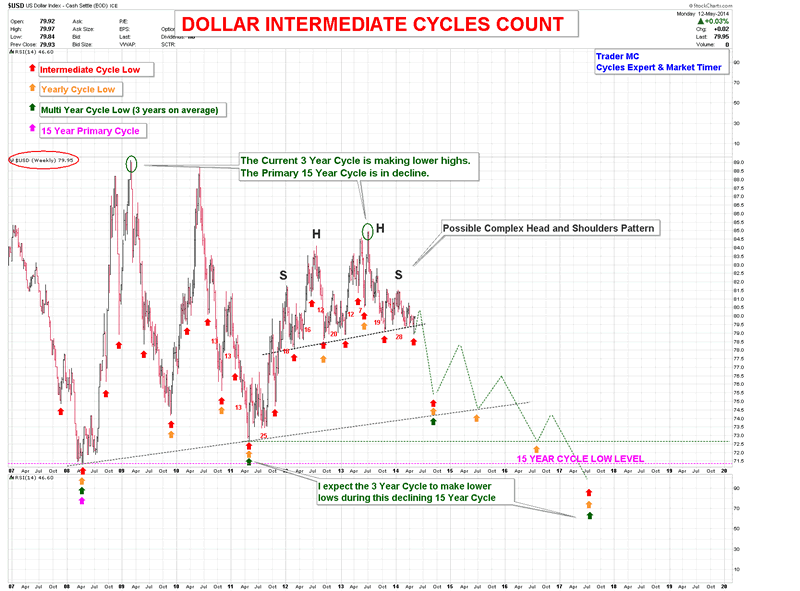
A closer view shows that the Dollar is currently in the second 3-Year Cycle which failed to print a higher high. We can also see that the Dollar is probably making a Complex Head and Shoulders pattern with dual heads. I expect the Dollar to break below the neckline of the Head and Shoulders pattern as it is time for the Dollar to print a 3-Year Cycle Low. Once the Dollar breaks below 2011 low, the setup of lower highs and lower lows will be in place.
Dollar Intermediate Cycles Chart
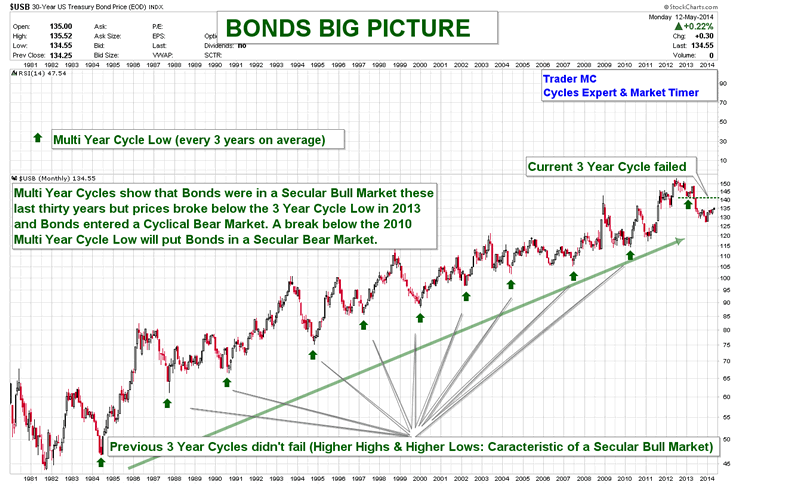
With the Dollar getting weaker and weaker, the Fed is buying Treasury Bonds with newly created money. Here you can see that Bonds are also following a 3-Year Cycle and for the first time since thirty years the Bonds made a failed 3-Year Cycle last year (the price broke below the previous 3-Year Cycle Low) which is characteristic of a down trending asset. Therefore Bonds entered a bear market last year and I expect several years of downtrend.
Bonds Yearly Cycles Chart
The declining Dollar and the bear market in Bonds should be very bullish for Gold. Gold is following an 8-Year Cycle which is composed of a 5-Year and a 3-Year Cycle. You can see on the following chart that Gold did not break below its 8-Year Cycle Low and the secular bull market is still intact.
Gold Yearly Cycles Chart
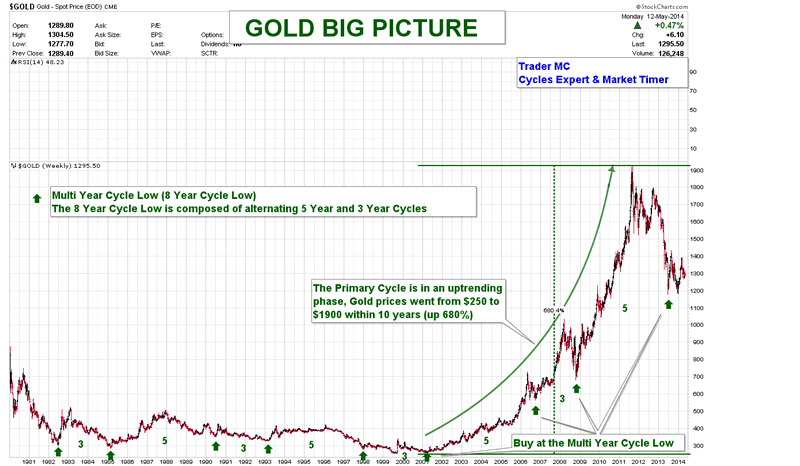
The Dollar has entered its 15-Year Cycle decline which should send the next major up leg for Gold. The primary Cycles are showing that Gold is still in an uptrend and the Dollar should decline in the coming years and will be seriously devaluated.
Trader MC
Company: Cycle Trader MC OU
Web site: http://tradermc.com
Email: contact@tradermc.com
My analysis covers different assets – Market Indexes, such as US, Europe, Emerging Markets, China, Russia etc., Commodities, Currencies (Forex Trading), Bonds and Rates. In addition to the Markets Updates for MC Members, I also post real-time Trading Alerts for MC Leveraged Members for a more aggressive strategy in all the sectors. Besides the market analysis, this site also contains Cycles Count Updates for all Market Assets, including the Forex Market.
© 2014 Copyright Trader MC - All Rights Reserved
Disclaimer: The above is a matter of opinion provided for general information purposes only and is not intended as investment advice. Information and analysis above are derived from sources and utilising methods believed to be reliable, but we cannot accept responsibility for any losses you may incur as a result of this analysis. Individuals should consult with their personal financial advisors.
© 2005-2022 http://www.MarketOracle.co.uk - The Market Oracle is a FREE Daily Financial Markets Analysis & Forecasting online publication.