


Time to Admit That Gold Peaked in 2011?
Commodities / Gold and Silver 2014 May 06, 2014 - 05:10 PM GMTBy: Jeff_Clark

 Have you seen this “real price of gold” chart that’s been making waves? Among other things, it purports to show the gold price adjusted for inflation over the past 223 years. Notice the 1980 vs. 2011 levels.
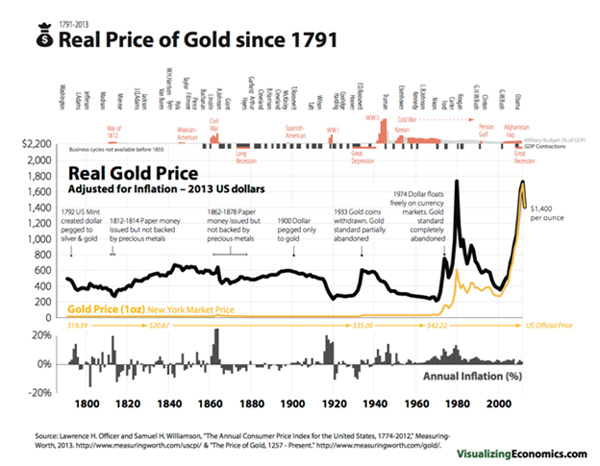
The chart makes it seem that on an inflation-adjusted basis, gold has matched its 1980 peak in 2011, or nearly so. A mainstream analyst who still thinks of gold as a “barbarous relic,” a government official who doesn’t want people to think of gold as money, or an Internet blogger looking for some attention might try to convince you that this proves that the gold bull market is over, arguing that the 2011 peak of $1,921 is the equivalent of the 1970s mania peak of $850 in January of 1980.
The logic is flawed, however; even if it were true that gold has matched its 1980 peak in inflation-adjusted prices, it would not prove that the top is in this time. This is not the 1970s, the global economy is under very different pressures, and there’s no rational basis at all for saying the top this time has to be at the same or similar level as last time.
That’s even if it were true that gold has matched its 1980 peak—but it hasn’t.
Inflation-Adjusted Gold Has NOT Matched Its 1980 Peak
First, if you go by official US Bureau of Labor Statistic numbers, $850 in 1980 is equivalent to $2,320 in 2011, when gold hit its peak thus far in the current cycle. (It’s $2,403 in 2013 dollars, as is said to be used in the chart.)
We don’t know what data the authors of the chart used, nor their inflation adjustment method, so it’s hard to say what the problem is, but at the very least, we can say the chart is very misleading.
But there’s more. As you probably know, the government has made numerous changes to the way it calculates inflation—the Consumer Price Index (CPI)—since 1980. So, even the BLS number we’ve given grossly underestimates the real difference between the 2011 and 1980 peaks.
For a more apples-to-apples comparison, we should adjust for inflation using the government’s 1980 formula. And for that, whom better to ask than John Williams of Shadow Government Statistics (AKA Shadow Stats), the world’s leading expert on phony US government statistics?
I asked John to apply the CPI formula from January 1980 to the $1,921 gold price in 2011, to give us a more accurate inflation-adjusted picture. Here’s what his data show.

Using the 1980 formula, the monthly average price of gold for January 1980 would be the equivalent of $8,598.80 today. The actual peak—$850 on January 21, 1980—isn’t shown in the chart, but it would equate to a whopping $10,823.70 today.
The Shadow Stats chart paints a completely different picture than the first chart. The current CPI formula grossly dilutes just how much inflation has occurred over the past 34 years. It’s so misleading that investment decisions based on it—like whether to buy or sell gold—could wreak havoc on a portfolio.
This could easily be the end of the discussion, but there are many more reasons to believe that the gold price has not peaked for the current bull cycle…
Percentage Rise Has Been Much Smaller
Inflation-adjusted numbers are not the only measure that matters. The percentage climb during the 1970s bull market was dramatically greater than what we experienced from 2001 to 2011. Here’s a comparison of the percentage gain during both periods.

From the 1970 low to the January 1980 peak, gold rose 2,346%. It climbed only 535% from the 2001 low to the September 2011 high—nowhere near mimicking that prior bull market.
Silver Scantly Participated in the 2011 Run-Up
After 31 years of trading, silver has yet to even reach its nominal price from 1980. It surged to $48.70 in 2011—but it hit $50 in January 1980.
On an inflation-adjusted basis, using the same data from John Williams, silver would need to hit $568 to match its 1980 equivalent.
The fact that silver has lagged this much—when its greater volatility would normally move its price by a greater percentage than gold—further shows that 2011 was not the equivalent of 1980.
No Bubble Characteristics in 2011
I’ll get some arguments from the mainstream on this one. “Of course gold was in a bubble in 2011—look at the chart!”
Yes, gold had a nice run-up that year. It rose 38.6% from January 1 to the September 6 peak. Anyone holding gold at that time was very happy. But that’s not a bubble. One of the major characteristics of a bubble is that prices go parabolic.
And that’s exactly what we saw in 1979-1980:
- In the 12 months leading up to its January 21, 1980 peak, gold surged an incredible 270%.
- In contrast, the year leading up to the September 6, 2011 peak, the price climbed 48%—very nice, but hardly parabolic, and less than a fifth of the 1970s runaway move.
No Global Phenomenon in 1980 (Next Time It Will Be)
In the 1970s, the “mania” was mostly a North American phenomenon. China and most of Asia didn’t participate. When inflation grips the world from all the money printing governments almost everywhere have engaged in, there will be a much greater demand for gold than in 1980.
When that day comes, there will be severe consequences for those who don’t have enough bullion. Not only will the price relentlessly move higher, but finding physical gold to buy may become very difficult.
Comparable Price Moves? So What?
The argument we started with is really the clincher. It doesn’t matter how today’s gold prices compare to those from prior bull markets; what matters are the factors likely to impact the price today. Are there reasons to own gold in the current environment—or not?
First, a comparison: Apple shares surged 112% in 2007. After such a run-up, surely investors should’ve dumped it, right? Well, those who did likely regretted it, since it ended that year at $180 and trades over $590 today. In fact, even though it had already risen dramatically and in spite of it crashing with the market in 2008, there were plenty of solid reasons to buy the stock then, not the least of which was the introduction of the iPhone that year.
So should we sell gold because it rose 535% in a decade? As with the Apple example above, that’s not the right question.
There are, in fact, several more relevant questions for gold today:
- What will happen with the unprecedented amount of money that’s been printed around the world since 2008?
- Why are economies still sluggish after the biggest monetary experiment in history?
- Global debt and “unfunded mandates” are at never-before-seen levels; how can this conceivably be paid off?
- Interest rates are at historically low levels—what happens when they start to rise?
- Regardless of your political affiliation, do you trust that government leaders have the ability and willingness to do what’s necessary to restore the economy to health?
If these issues were absent, maybe we’d change our position on precious metals. But until the word “healthy” can honestly be used to describe the fiscal, monetary, and economic state of our global civilization, gold should be held as an essential wealth-protection asset.
Today’s volatile world is exactly the kind of circumstance gold is best for.
The message here is clear, my friends. Regardless of the measure, gold has not matched its 1980 peak. And the reasons to own it have not faded. Indeed, they have grown. Continue to accumulate.
Learn about the best ways to invest in gold—how and when to buy it, where to store it for maximum safety, and how to find the best gold stocks—in the free 2014 Gold Investor’s Guide.
Disclaimer: The above is a matter of opinion provided for general information purposes only and is not intended as investment advice. Information and analysis above are derived from sources and utilising methods believed to be reliable, but we cannot accept responsibility for any losses you may incur as a result of this analysis. Individuals should consult with their personal financial advisors.
Casey Research Archive |
© 2005-2022 http://www.MarketOracle.co.uk - The Market Oracle is a FREE Daily Financial Markets Analysis & Forecasting online publication.