How Trans Pacific Partnership Agreement (TPPA) affects America and its Partners
Economics / Global Economy May 05, 2014 - 03:19 PM GMTBy: Sam_Chee_Kong
 TPPA or Trans Pacific Partnership Agreement is a trade agreement between 11 countries namely Malaysia, Singapore, Philippines, Vietnam, Brunei Darussalam, Japan, Australia, New Zealand, America, Peru, Mexico, Chile. Details are vague due to the secretive nature of the whole process and not much is being reported in the media. The first round of talks was held in Melbourne Australia in March 2010. Since then there are already 19 rounds of talks with the last one in Brunei Darussalam. It is believed that TPPA operates within the same scope of other Free Trade Agreements. It involves free trade policies such as opening up of the domestic market, subsidies, tariffs, copyright rule, intellectual property rights and enhancing legal protection for foreign investors.
Before assessing the viability of TPPA, it will be better to analyze the performance of other trade agreements such as NAFTA. Also we also like to know how free trade agreements being used in the United States Government’s economic blueprint to bring prosperity back to America. The once invincible American economy started showing signs of crumble in the 1970s when the growth in real wages stagnated. The stagnation in wages is partly due to the offshoring of manufacturing operations to other countries by American corporations. This is unavoidable as high wages in American is making tough to compete with low-wage Asian export oriented and import competing industries. As a result some jobs are either eliminated or moved abroad and created an excess supply of labor. This gives Corporations an upper hand in determining the wage levels. One thing to note is that although growth of real wages stagnated, real GDP per capita rose by about 30% during that period. This can be shown by the graph below on United States GDP per capita growth since 1970 till 2013.
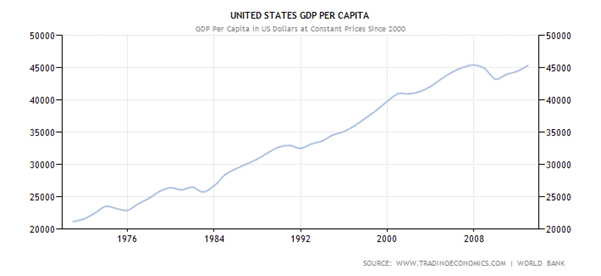
Since the rise in real wages does not commensurate with the rise in GDP then where has the extra GDP gone to? One explanation is that it went to the top 10% of the population and not to the workers. This is because the trickle down effect are not reaching the workers. Hence, this contributed to the increase in income disparity among the working class and the top 10% of the elites.
Further to this, the Balance of Trade or Merchandise Trade continues to lose ground and went into deficits in 1975. This can be show by the following graph.
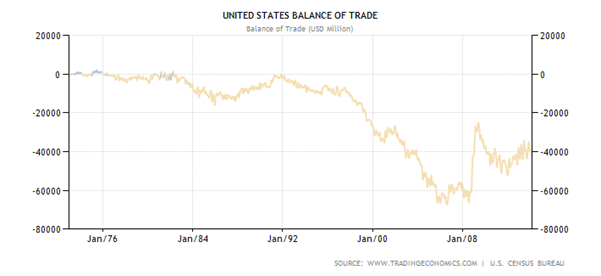
Previous policies on trade promotion (increasing imports) by reducing trade barriers and encouraging Multinationals to invest abroad led to further deterioration of the Trade Balance. As have explained, this led to broadening the income inequality and the trade deficit. The United States went from having a positive Current Account of $2.3 billion in 1980 to a $151.2 billion deficit in 1994. The resulting rise in imports coupled with the fall in exports heightened the decline in real wages due to the following.
- Cheaper imports lower the demand for competing goods thus reduce their prices and eventually will lower the wages of the workers.
- Increased outward Foreign Direct investments means more job will be eliminated and thus the bargaining power of workers is further deteriorated.
- Unfair trade practices by foreign competitors such as China and Japan further erode the demand for American goods. China’s strategy on artificially lowering the Yuan and Japan’s unfair trade protection by the Kiretsuhelped promote their export driven economies. Kiretsu is a group of Japanese corporations with inter-locking shareholding controls most of the Japanese economy.
To stem the trade balance from spiraling out of control and to lift real wages, new economic measures are needed. The following are some of the measures being adopted.
- Expanding the demand of labor
- Improving labor skills
- Reforming the financial institutions
- Regulating the global market place through trade agreements
As noted, part of the strategy is to use trade agreements to convince partners to adopt and adhere to rules and regulations of the American economy. Examples of such trade agreements include GATT, NAFTA, APEC and so on.
The birth of NAFTA
The origin of NAFTA can be traced back to the oil crisis in 1970s. During the oil crisis in the 1970s, OPEC raised the price of oil four fold. As a result oil exporting countries are flushed with cash. Unable to spend all their wealth, the balance are deposited back into Western Banks. At the meantime the rise in oil prices also affected much of the oil importing countries due to the effect of ‘imported inflation’. To counter the inflationary effect, interest rates were raised and thus dampen the demand for credit. This helped create an environment of excess funds in the banking sector. Instead of having them lying idle, bankers began looking for new avenues to lend out their excess funds.
Since most Western countries are mired with economic slowdown, the other option is to lend to developing or emerging economies. Mexico is one of their choices because it was sitting on top a vast oil reserve and needed money to exploit it. Hence, foreign money started making their way into Mexico. Multinational banks like Citicorp, Chase Manhattan and Bank of America bankrolled the Mexican economy to the tune of $60 billion. Awash with funds the Mexican economy boomed and grew 38% from 1977 to 1981.
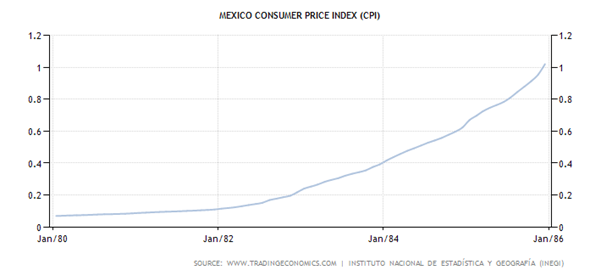
Unfortunately, good times will not last forever and after 1981 the price of oil fell. Being dependent on oil receipts to finance its economy, Mexico suddenly found out that the once steady inflow of cash halted. Its economy went into a recession which also affected the inflow of foreign money. Without foreign money to finance the economy, the Mexican Government started to print more money. The increased money supply helped fuel inflation. Inflation spiraled into hyper-inflation as the CPI rose from 12 in 1981 to 100 in 1985 as shown by the graph below. This represents a rise of 800% in 4 years.
Thus, this led the Mexican economy into deep trouble and at the verge of collapsing. At the meantime, the Reagan administration began pushing Mexico to open up its market for American goods. Debt restructuring is offered as a bait. As a result, bilateral relations is establish between the United States and Mexico in areas like free trade, exchange rate convertibility or also known as ‘currency board’, debt restructuring and so on. After three years of negotiations and about 2000 pages of rules and regulations governing the movement of goods, this led to the birth of NAFTA or North American Free Trade Agreement.
Advantages of NAFTA
It was a win-win situation for the Americans because by opening up its market to the Mexicans, their export earnings enabled them to pay off their foreign debts. At the same time the American corporations known as maquiladoras set up shop at the border to take advantage of Mexico’s cheap labor. The finish products are then sent back to the U.S to be sold at a much higher price. Thus this also helped increase the profitability of American corporations while at the same time Americans banks are getting paid for the billions they have lent earlier.
NAFTA only facilitate cross border movement of capital but not labor. Hence, cross border investments between America, Mexico and Canada are encouraged but movement of labor discouraged. The huge inflow of American investments helped sustain Mexico’s economy and hence there is less incentive for illegal Mexican workers to cross over to look for better jobs. Thus the problem of illegal immigration is part solved for both sides for the moment.
As for the Mexicans they are also reaping the benefits of improved economic conditions such as more jobs and better pay and thus higher standard of living. There are also pressures for local companies to upgrade their skills and efficiency in order to compete with the maquiladoras. Local businesses need to adjust to the international quality and standards if not risked being left out. Those survived are able to command better pricing for their products because of the breakdown in the pricing barrier.
Another benefit is the inflow of funds which subsequently helped revive the Mexican economy. The Mexican economy once again humming with activities, new jobs are created, wages are rising, new roads being built, more schools, better equipped hospitals and so on. Thus the standard of living among the people also went up.
Disadvantages of NAFTA
Firstly, it has been argued that most of the maquiladoras are ‘assembly plants’ in nature where skills are hardly transferred. Most of the components are imported from America and as a result there is little value added services such as producing parts and components gained by the local suppliers. Thus what the American did was in line with most foreign investors which amounted to exporting their boxes while leaving their brains at home. Thus most of the R & Ds are done at home while assembly work which requires manual labor done in Mexico. In the end there is little or no transfer of technology.
Secondly, NAFTA did bring some development to the Mexican economy as described above. However the spillover effect such as wage increase, better health system and infrastructure are not evenly distributed. One of the remnants is the widening of the income inequality gap. Since most of the developments are taking place up north near the American border, only bordering states such as Nuevo Leon are benefitting. According to a report by the Economist (October 2000), their average income is six times more than the southern states such as Chiapas and Oaxaca. Among others, infant mortality among the richest 20% is 13 per 1000 while the poorest 20% is 52 per 1000. Children from the richest 10% spend 12.1 years in school while the poorest spend an average of 2.1 years in school.
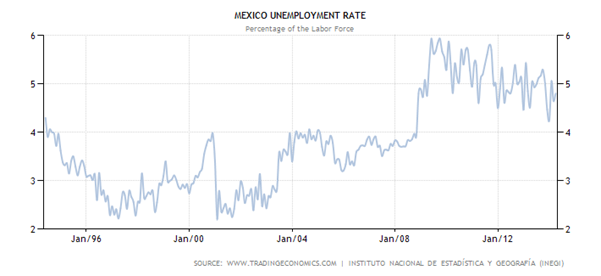
Thirdly, due to the influx of more than 1000 maquiladoras with their cost efficient, economies of scale and technologically advanced operations, immediately they crowded out the local Mexican companies in terms of market share. As a result thousands of indigenous Mexican factories failed and hundreds of thousands of people lost their jobs. As you can see from the chart below initially the unemployment rate did went down due to the influx of the maquiladoras which requires labor. However as time passed, the unemployment rate rose from about 2.2% in 1996 to about 5% in 2013. During this period the average unemployment rate was about 4%. Thus it can be concluded that after 20 years of inception the promised on new jobs being created does not materialized.
Fourthly, during the initial stage in 1994, NAFTA did bring with it the much needed foreign investors into Mexico. Not only direct FDIs came but also portfolio investors who are buying into Mexican bonds which pays higher interest rates. Thus, this led to the growth of the money supply which led to a boom in consumer spending. Mexicans are splurging on consumer goods that are finance by personal loans and credit cards. When Alan Greenspan, the then Federal Reserve Chairman hike interest rates the party was over. The short term hot money abandoned the Government bonds and stock market and started pulling out from Mexico. Hence, it resulted in a credit crunch. The lack of foreign money to finance imports resulted in the collapse of the Mexican Peso in December 1994. In December 1994 the Peso lost half of its value which then contributed to the rise of imports costs. This also led to the spiking of the inflation rate to 52%. Being unable to cope with high costs of credit and economic downturn, thousands of indigenous companies closed down and resulted to more than a million people jobless.
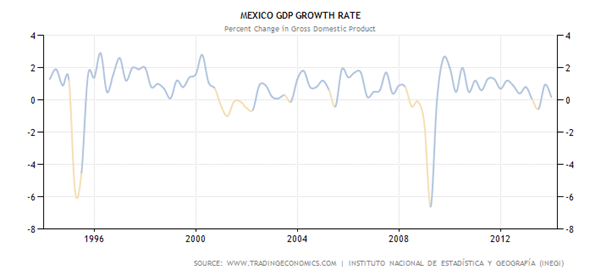
The Mexican GDP felled 7% subsequently as indicated by the chart below. Although Mexico’s economy recovered at a later stage, its GDP growth is anemic. Mexico’s annual GDP growth which averages 2.39% from 1994 to 2013 doesn’t seem to be very impressive at all. In 2013, its GDP recorded only a paltry 1.05% growth.
Wrapping Up
From the empirical evidence above, it clearly shows that Mexico didn’t benefit much from NAFTA and that is one reason why it was not mentioned much nowadays. NAFTA also failed to help America turnaround its economy. Since the introduction of NAFTA in January 1994, the two-way trade between America and Mexico did improved. This also led to more jobs being created during the first few years as a result from increased exports to Mexico.
Going forward, more American Multinationals are offshoring their production facilities not only to Mexico but to East Asia especially China. This has affected the delicate balance between imports and exports. As American corporations moved their production overseas, their manufacturing base in America shrunk and resulted in lower production of goods and hence also affected the exports. To rectify the shortfall, more goods are imported especially from the export centers in developing countries such as China, Singapore, Malaysia, Taiwan and so on. How will the increased imports affect the GDP, trade deficit and jobs? GDP can be defined as the following,
GDP = C + I + G + (X-M) where,
C = Private Consumption
I = Investment
G = Government Spending
X = Exports
M = Imports
Other things being equal, when import rise GDP will shrink and similarly GDP will expand when export rises. Understanding this concept is important because import is like the costs of doing business and export is like sales or revenue to a company. What happens when cost frequently exceed sales? The company loses money and eventually will go bankrupt. In the same manner a country’s trade deficit is like a company’s loss. A country cannot forever run trade deficits because it needs to find a way to finance it. One way is to borrow from abroad to finance its deficits. However, this will only be feasible when the funds are used to finance imports that go into investment projects. When those investments start to generate income, it will help to pay for the imports. But if it is used to finance consumption then it will be foolish.
As indicated above, one of the objectives of the new economic blueprint is to eliminate the trade deficit. Trade agreement is one of the solutions implemented to reverse the trade deficit. Through trade agreement, countries or partners are forced to open up their market to American Multinationals. Barriers of entry are either eliminated or lowered, tougher rules and regulations are enforced to protect American interest. However as can be seen above, these measures failed to eliminate the trade deficit. Thus it can be conclude that trade agreements such as NAFTA and GATT failed to reverse the trade deficit as promised. Below is the chart for the balance of trade.
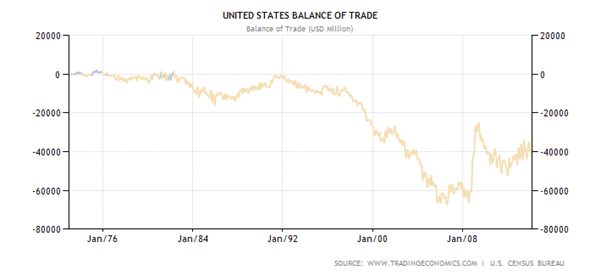
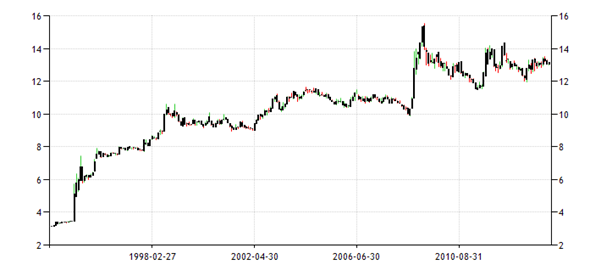
Having seen the Mexico trade deficit rebounded when their Peso devalued by about 50% in December 1994 (see below). American policy makers also tried their policy on dollar depreciation in an effort to reverse the Trade Deficit.
Mexico Peso
Source : Tradingeconomics.com
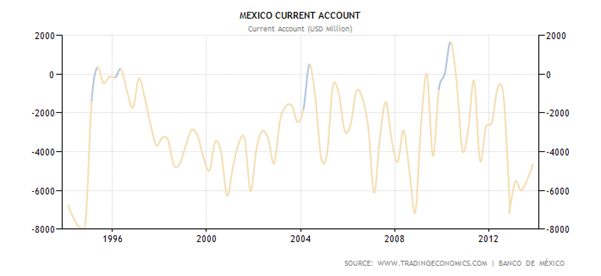
This also failed because you needed more than a currency devaluation to reverse a trade deficit. When the Peso was devalued it automatically make the Mexican exports cheaper and imports more expensive. Thus, when Mexico’s exports soared (see below) so does the foreign currency receipts.
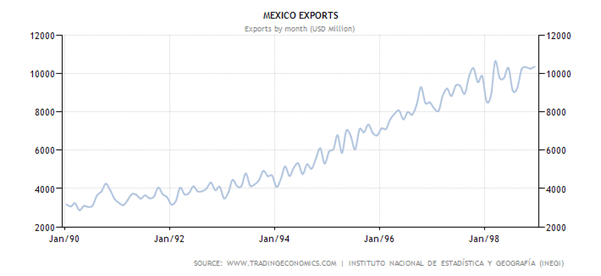
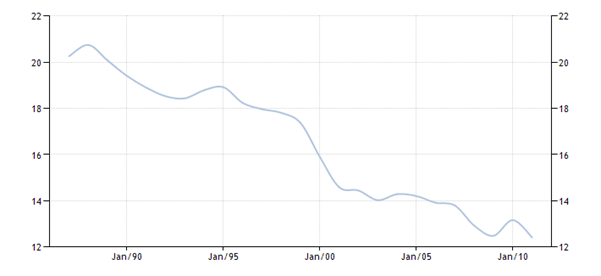
Hence, it can be deduced that it was Mexico’s growing manufacturing base that help makes the difference. Below is the chart of America’s manufacturing value added to GDP (%). From about 21% in the late 1980s, it fell to about 12% in 2012. The shrinking manufacturing base in America failed to provide the impetus to turnaround the trade deficit. To reduce trade deficits either import has to come down or export to go up. Hence, in a dollar weakening environment a reduction of trade deficit can best be achieved by accompanying efforts to increase exports.
United States Manufacturing value added to GDP (%)
Source : World Bank
Thus, it can be concluded that trade agreements such as the proposed TPPA is not the best solution to improve trade, eliminate trade deficits and create jobs without incurring any negative repercussions. The pros and cons of free trade need to be carefully evaluated before committing to such trade agreements.
by Sam Chee Kong
cheekongsam@yahoo.com
© 2014 Copyright Sam Chee Kong - All Rights Reserved
Disclaimer: The above is a matter of opinion provided for general information purposes only and is not intended as investment advice. Information and analysis above are derived from sources and utilising methods believed to be reliable, but we cannot accept responsibility for any losses you may incur as a result of this analysis. Individuals should consult with their personal financial advisors.
© 2005-2022 http://www.MarketOracle.co.uk - The Market Oracle is a FREE Daily Financial Markets Analysis & Forecasting online publication.


