


Is it Time to Sell Australia Stock Market?
Stock-Markets / Stock Markets 2014 May 04, 2014 - 01:54 PM GMT

 XJO
XJO
I had initially suspected a major peak was in place back in April 2013, with a potentially completed pattern it looked like that forecast was starting to work, but nothing tends to be that simple these days, the decline from the 2013 peak started to look very corrective, so I had to abandon the call for a peak and look for alternatives ideas that would suggest a move higher, even if a marginal new high.
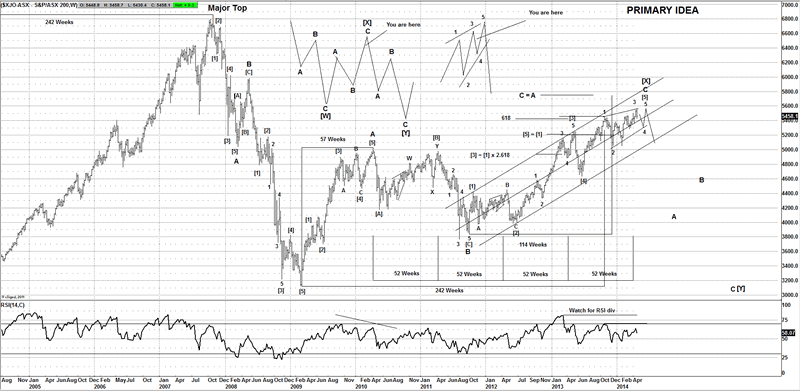
I won't bore readers with the details of what has happened over the past year; suffice to say I think the market is now starting to clear up. If you look at the price action over the past 12 months you can clearly see it's chopped higher, whilst the US markets went on a tear higher the same can't be said for the Australian markets.
I suspect the market is involved in an ending diagonal, technicians sometimes refer to this as a bearish wedge, although it still needs a bit more work, but if I am correct we could be setting up for a rather larger decline lower. I would like to see a bit more downside for wave 4 of the wedge idea, to around 5350, then setup for a final move higher in wave 5, that would setup a nice selling opportunity.
Long term targets reside near 3000.
XFJ
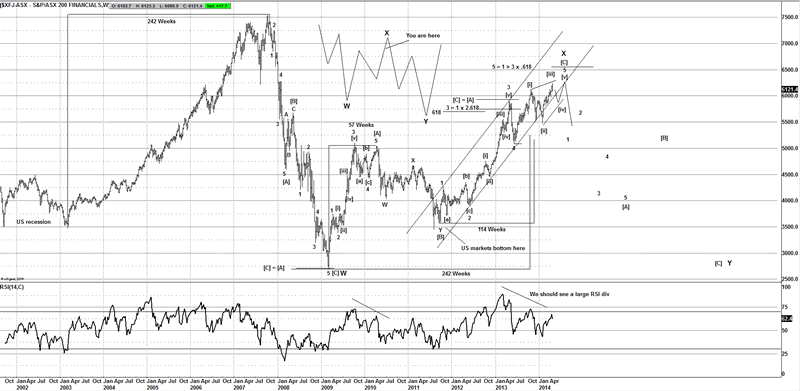
Australian traders should be fully aware that the XJO is heavily dependent on the banks and financial stocks, the sector has a weighting over 50% of the XJO, so it plays a huge part. If my memory serves me correctly there are 5 or 6 banking stocks in the top 10 weighted stocks in the XJO, so it would be wise to look at the financial sector and see it provides us with any clues.
This sector suggests a possible ending diagonal; currently I think it's in wave [iv], so ideally a bit more downside then rally for wave [v]. That should align nicely with the same idea on the XJO.
XSO
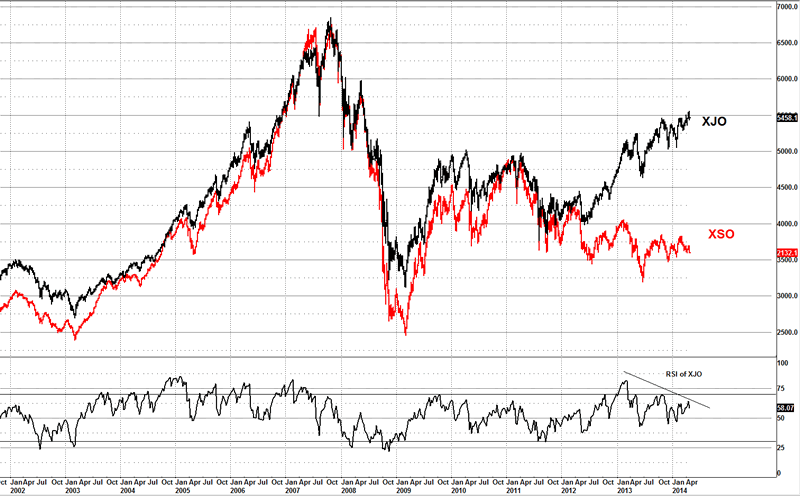
I am always dubious about a market when I see areas of the market not following the main market, whilst those divergences can stay around for a while; the health of the market is always under threat.
If we look at the XJO VS XSO we can see the small ordinaries have not followed the main market higher, that in my opinion is a warning for traders, so we can conclude its really the financial stocks via XFJ that is dragging the XJO higher, once/if the XFJ is complete the XJO will follow.
I caution the bulls that still have a lot invested in stocks, if I am correct and the markets are setting up for a major secondary peak, it could be a peak that will not be seen be seen for years to come.
Until next time
Have a profitable week ahead
Click here to become a member
You can also follow us on twitter
What do we offer?
Short and long term analysis on US and European markets, various major FX pairs, commodities from Gold and silver to markets like natural gas.
Daily analysis on where I think the market is going with key support and resistance areas, we move and adjust as the market adjusts.
A chat room where members can discuss ideas with me or other members.
Members get to know who is moving the markets in the S&P pits*
*I have permission to post comments from the audio I hear from the S&P pits.
If you looking for quality analysis from someone that actually looks at multiple charts and works hard at providing members information to stay on the right side of the trends and making $$$, why not give the site a trial.
If any of the readers want to see this article in a PDF format.
Please send an e-mail to Enquires@wavepatterntraders.com
Please put in the header PDF, or make it known that you want to be added to the mailing list for any future articles.
Or if you have any questions about becoming a member, please use the email address above.
If you like what you see, or want to see more of my work, then please sign up for the 4 week trial.
This article is just a small portion of the markets I follow.
I cover many markets, from FX to US equities, right the way through to commodities.
If I have the data I am more than willing to offer requests to members.
Currently new members can sign up for a 4 week free trial to test drive the site, and see if my work can help in your trading and if it meets your requirements.
If you don't like what you see, then drop me an email within the 1st 4 weeks from when you join, and ask for a no questions refund.
You simply have nothing to lose.
By Jason Soni AKA Nouf
© 2014 Copyright Jason Soni AKA Nouf - All Rights Reserved
Disclaimer: The above is a matter of opinion provided for general information purposes only and is not intended as investment advice. Information and analysis above are derived from sources and utilising methods believed to be reliable, but we cannot accept responsibility for any losses you may incur as a result of this analysis. Individuals should consult with their personal financial advisors.
WavePatternTraders Archive |
© 2005-2022 http://www.MarketOracle.co.uk - The Market Oracle is a FREE Daily Financial Markets Analysis & Forecasting online publication.