


How Bubbles Burst In A Global Market
Stock-Markets / Liquidity Bubble May 02, 2014 - 06:52 PM GMTBy: Raul_I_Meijer

 More curious numbers every day. An increase of 288,000 jobs in the BLS report’s Establishment Survey, but a decline of 73,000 jobs in the Household Survey; an additional 988,000 Americans left the labor force for an all time high of 92 million not in the labor force, as the Labor Participation Rate moved towards lowest since January 1978 and the Birth/Death model added 234,000 jobs. This is where I think: you tell me.
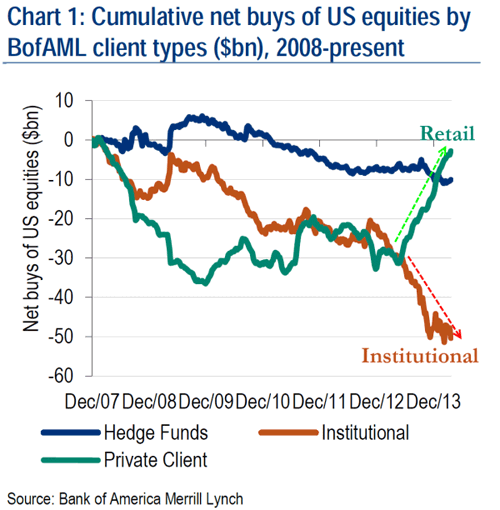
Most interesting graph of the day must be the Bank of America one Tyler Durden posted, which shows where the smart money parted ways with the mom and pop greatest fools.
That takes me to a Jeremy Grantham note Durden also posted, in which Grantham describes how he and his people at GMO have tried to define bubbles to figure out when this one will burst. His preliminary conclusion is, with a lot of caveats, and I’m oversimplifying, that he would expect a run up in the S&P all the way to 2250 or higher before the crash, which he sees happening around the time of the next US presidential elections, in 2016.
- … this year should continue to be difficult with the February 1 to October 1 period being just as likely to be down as up, perhaps a little more so.
- But after October 1, the market is likely to be strong, especially through April and by then or in the following 18 months up to the next election (or, horrible possibility, even longer) will have rallied past 2,250, perhaps by a decent margin.
- And then around the election or soon after, the market bubble will burst, as bubbles always do, and will revert to its trend value, around half of its peak or worse, depending on what new ammunition the Fed can dig up.
Looking at that, I’m wondering about the double trend in that graph above: how much longer will mom and pop keep buying in the face of the smart money leaving, and how much more can the smart money sell? Does that look like a trend that can last another 30 months? What about UK housing prices, can they rise 30 more months? Does Grantham think Japan will last another 30 months, given that Abenomics looks like a sure failure, despite the ‘great’ March sales numbers which were due only to that April 1 tax hike? What does he think of China, where, no matter how much numbers may contradict each other, it looks hard to deny matters have hit a serious snag?
I’m wondering if models like Grantham’s maybe look too much and too exclusively at American markets through history, and pay too little attention to the fact that the – potential – influence of other markets has increased to higher levels than seen in at least a long time. Is that what we see when he posits the 2016 US elections as a possible turning point? That his theories are based on too much all US all the time, perhaps because the advent of Asian and other emerging markets has no precedent in history over the past 100 years?
I know that bubble collapses are impossible to pinpoint, and I know that Grantham comes with all the caveats he builds into his notes, and that it’s hard to foresee which central banks will come with which next round of bankers’ wives and children first, but then again, Grantham does post this graph from John Hussman, and he does write this comment:
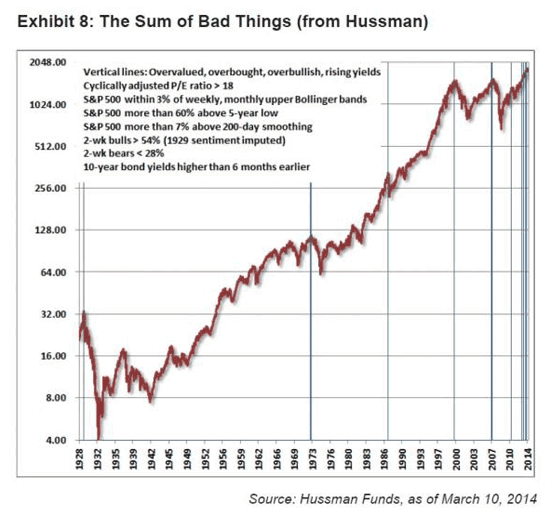
Exhibit 8 shows an equally disturbing Hussman exhibit in which he has collated very bad things that happen to markets. His exhibit suggests that whenever this large collection of troublesome predictions line up like they have recently there has been a very serious and fairly immediate market decline. While I have no quarrel with the eventual outcome and recognize that possibly the bear market’s time may have come, particularly in light of recent market declines (April 13, 2014), I still think it’s less likely than my suggestion of a substantial and quite lengthy last hurrah.
Hussman’s graph, as is obvious, is based on US markets as much as Grantham’s thoughts are. Perhaps that is simply too limited in today’s world. Because I don’t think anyone could argue that either China or Japan, or Europe, would NOT be able to sink the S&P. Whereas 50 years ago, that would have looked entirely different.
Anyway, that struck me in what Grantham writes. Not that it’s impossible that a real big crash, of which he’s as sure as I am by the way, will take 30 more months to materialize, but I see too many risk factors around the globe that could sink the S&P, to agree with his analysis. For instance, I think the Fed may feel it can continue to taper because it’s found a way to transfer the negative effects to emerging markets (I’m sure that’s a major consideration), but a major shock in some of those markets may backfire and take enough air out of Wall Street to cause serious damage there.
All that remains in today’s financial systems is a paperthin layer of trust, in the Fed, the S&P, the government, and that’s true for many countries, with their own central banks etc. In the present time, those risks no longer simple add up, they get multiplied into a kind of exponential function. And that’s new, historical models don’t capture that. It’s new to the extent that analyzing only the S&P’s history may well be woefully insufficient. Global financial markets have developed a cross-breeding incestuous relationship that’s a sort of an all for one and one for all, in which they all rise together and get swallowed up by a sinkhole together. And the more QE is applied across global central banks, one after the other, the deeper that hole becomes, in an exponential fashion. I think that needs to be part of any US market analysis.
By Raul Ilargi Meijer
Website: http://theautomaticearth.com (provides unique analysis of economics, finance, politics and social dynamics in the context of Complexity Theory)
Raul Ilargi Meijer Archive |
© 2005-2022 http://www.MarketOracle.co.uk - The Market Oracle is a FREE Daily Financial Markets Analysis & Forecasting online publication.