


Stock & Commodity Markets Elliott Wave Analysis - 4th Mar 07 - What a Difference a Day Makes
Stock-Markets / Elliott Wave Theory Mar 04, 2007 - 07:19 PM GMTBy: Dominick

It's funny how one day can change everything for so many traders and investors. But at TTC we just did what we do every day and, as you're about to see, the strategy worked quite nicely!
First, we're still very proud to have ridden the bull market all the way up from last summer's lows, insisting each week that the ride wasn't over yet. After reaching the 1360 target on the SPX it was easy to say “done”, but I refused after reviewing literally hundreds of charts. Instead, I took the stance that a stronger, multi-decade Fib matrix target on the NYSE was asserting itself, and would need to be reached.
We got that high in February, only to find that the wave pattern had some finishing touches to put in on the NYSE. Once the pattern was complete, we zoned into the S&P's last target, along with a number it absolutely couldn't take out without sparking another huge rally. The target was in a range from 1462 to 1470, as was published in a previous update here, with the absolute “must hold” top number of 1481 reserved for subscribers only.
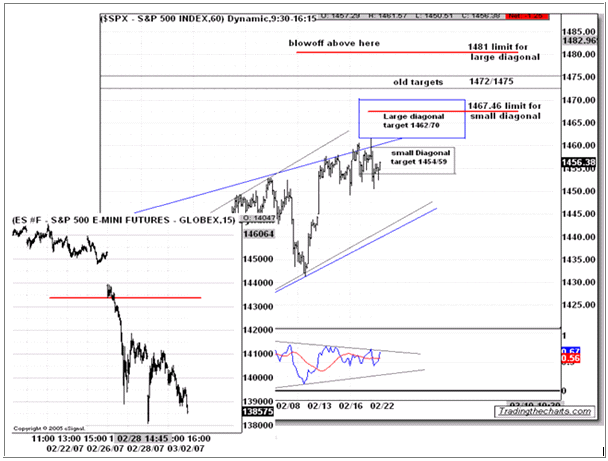
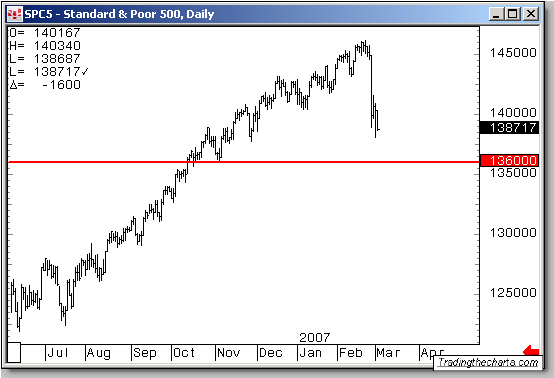
The chart above shows our working pattern, an ending diagonal we'd spotted and traded well in advance of other analysts. Going into last week, it already had touched the lower end of a larger diagonal and moved right into the target of a smaller one. After the gap down Tuesday morning, I came up with our magic number to use for confirmation of a high, which was 1433. The smaller chart on the left shows our confirmation of a top, along with the brutal selloff after losing that line.
At first, I'm sure many bulls and bears looked to buy the dip as they'd been trained to do, which is why the market actually tried to hold 1433 for awhile. We even made a few points scalping it in the chatroom, but I noted as it was holding that we were seeing a sloppy advance and that, if we lost that area, we'd lose another 20 points. Not yet knowing the type of selloff they were about to witness, few buyers probably realized another 20 handles in the S&P was the risk they were taking. But then reality kicked in. The market went directly to 1413, our next target, but couldn't hold as an electronic glitch at the exchange produced a huge spike down. Once that let go, there were no charts to use, just our broker's dome of the ES. Quotes were lagging, and everyone's stops along the summer rise were being hit as a day for the history books played out before our eyes.
What's a trader to do under a market being pressured like that? Keep selling? Well, we didn't play that game at TTC. The truth is, within our live chatroom members were told it was a time to reverse and buy! We didn't get low tick, but were happy to have bought at 1395, and watched the market rocket off the lows. Wednesday we planned on an inside day to digest this move and we got it. Intraday Fib numbers were pulling price like magnets. Targets of 1413 and 1418 proved to be resistance. When we woke up Thursday to another drop, I posted this prior to the opening:
“ If you have been trading a while, you'll know to shut off the TV's as they are blaming a million things on this drop. Its simple, the market is always looking for a retest of a low like Tuesday. Sometimes it's just above it, sometimes it's a spike and nasty reversal from it.
That said; don't think there isn't any risk here. At these lows, you must see a reversal so that something much larger doesn't happen.
Bottom line, the market was a short play from 5:00am but not sure about now. I will be looking to get long any reversal up.”
Recognizing the type of day that was setting up, we got in the trade and the ES took off from 1381 to 1412 like a Ferrari. Just another intraday move in the bag at TTC!
As promised in January, this is the year of volatility. With these kinds of swings, knowing what degree high might be in isn't on top of our list. Personally, I want to know where the next 30 points are, and there's no doubt in my mind that the action is not being caused by the news. Not when we have so many charts hitting exact targets and reversing.
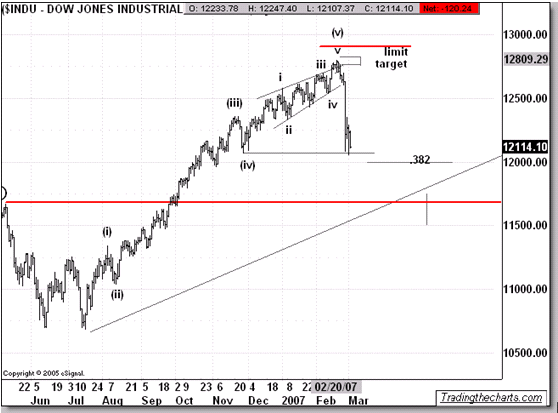
In the Dow, we had the same diagonal as the S&P, along with target and limit. Basically, you had your entry and your stop, using “Unbiased Elliott”. As you can see, price is attempting to take out the previous 4 th already, or is it? Look for more on that later in this update.
In the European forums, I posted the next chart on January 15 th and told them to enjoy. They really must have, as the Dax reached the Fork and dropped hundreds of points.
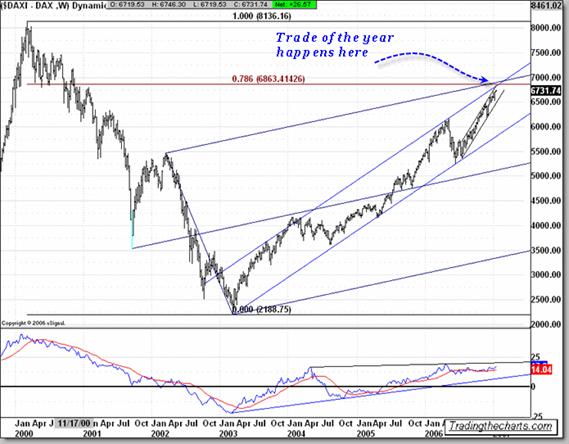
Here again, the precise target was hit just as it did at the May top that we called.
They say you don't hear the bells ringing at the top but you have to think maybe we did hear it this time. The important point is that the news we all woke up to on Tuesday morning was not the reason for the selloff. That was merely the excuse for a bubbling market that needed to boil over. How else could I have had all this evidence? So we woke up Monday and China was down big and Greenspan said we'll go into a recession. Greenspan? Didn't he retire?
Last week's updated included my sentiment against the very popular expectation of a cycle high in March. Working from that cyclical bias would have probably had us long into the largest single day point decline in years. Speaking of being caught wrong, I sincerely hope that readers were not hurt during this move, because it could have easily caused some serious financial damage. Traders were so used to buying the dips that they became extremely bullish, and even more telling, beaten up bears had finally capitulated and turned bullish, a sure sign of a high. I had mentioned many times that sentiment indicators weren't throwing off sell signals but my realtime conversations were sensing complacency. Members, even if you didn't short the top tick, I hope my 1433 line gave you a head's up in time to position yourself accordingly!
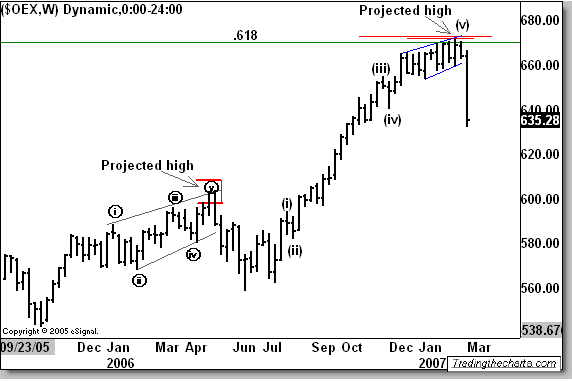
But even nonmembers who only read the weekly updates could have avoided being sucked into the market at precisely the wrong time, probably just from knowing the NYSE target we'd been tracking. For months now I've been publishing this next chart, and we've all watched it reach the target and reverse.
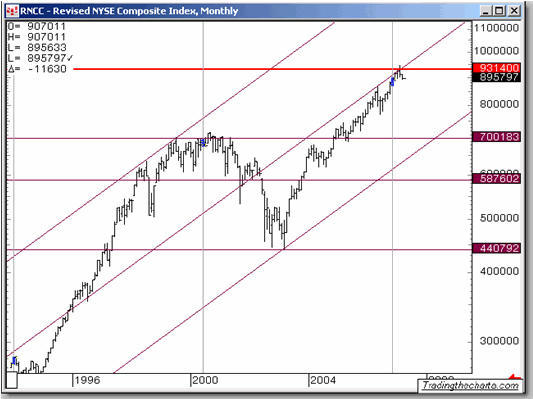
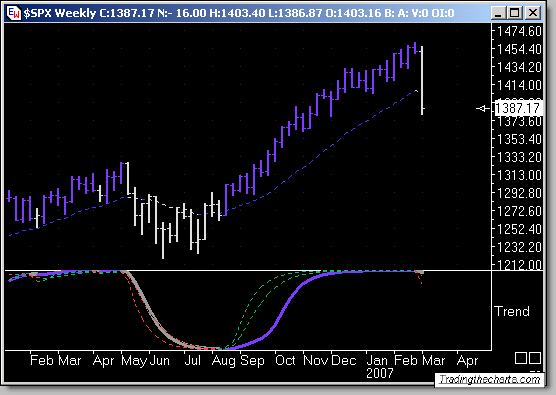
Not only did we get our expected high after a complete Elliott count, but the icing on the cake was to see confirmation from the trend charts, as the weekly finally turned on Tuesday morning! After seven months of keeping them free from lots of financial stress during a very powerful advance, members were amazed to see the new signal. A complete set of these proprietary charts, from the 5-minute to the weekly chart shown below, is available to members only www.tradingthecharts.com .
Other posting such as a low to low to high that was due and last week's Fibonacci time chart are just a few of the many reasons why this top came together and why it turned out so violently. Were we surprised? Of course not. In fact, we might have been the only ones riding this rally for every tick and finally reversing where it all came together with confirmation ! Now the question is, will it be a 1987 style crash or a healthy pullback that you will be upset selling into? As far as a crash, I don't think we have one on our hands, or at least not yet.
What Next?
Anyone that's willing to call the next major move so fast is guessing, or biased. We plan on trading these violent swings for another week or two and then make a big picture assessment. A big battle is about to take place early this year as traders defend their position of the markets and finally see what the real count will be. To B or not to B, that is the most asked question in Elliott land. Was this advance from the 2002 lows a B wave or was it and is it still an impulsive move that has much more to go? I'm sure many bearish traders are now feeling comfortable, but should they? The quickness of this selloff could actually open the door to other ideas later. A more grinding selloff that eventually ended in the way this one started would have been better accepted. Either way, we will be sure to be on top of it. Unless certain levels break, or bullish sentiment comes roaring in, we will be looking to scoop up a bargain very early this week. We hope to get a continuation of Friday's selloff as we have a number to buy that could mark some type of s/t low, otherwise we are prepared to pay up.
As the Dow chart shows, we are already at the previous 4 th wave, a good target to stop at. OH! And let's not forget my promise from last year that we will stop at 1360 to make a major decision. By the looks of the chart below, the market knows where it belongs, but do we get there now or later?
Unfortunately, traders are so focused on hearing a count and whether the top is in, that they will miss these huge moves that we will continue to get each and every day. Now more than ever, the only safe way to attack this market is in realtime. Check out the rest of the weekend big picture charts posted and then trade along intraday all still for $50 a month. And, if in a week you don't like it, send me an email and I'll refund you the full fee, no questions asked! Must join before March 9, 2007
Also make sure that you are receiving our monthly Newsletter that comes out Sunday, March 4 th . Erick Hadik, Richard Rhodes, Tim Ord and Ray Merriman will have updates in this month's issue. If you need to get onto the list, there is a link at the bottom of this page.
Bonds
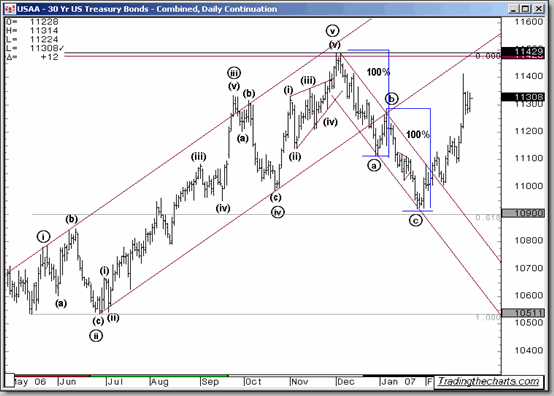
This week was also the week that our bond market chart came alive. Here is that same chart that seemed impossible just a few weeks ago. I know, greenie did it.
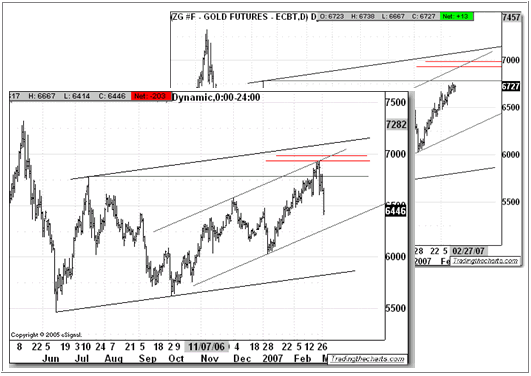
Metals
Here is one of the charts from one of Joe Oberon's previous updates showing a gold target and the result. Be sure to read this week's Precious Points for the latest on the volatile metals markets.
Have a profitable, and safe week trading, and don't forget:
“Unbiased Elliott Wave works!”
By Dominick
For real-time analysis, become a member for only $50
If you've enjoyed this article, signup for Market Updates , our monthly newsletter, and, for more immediate analysis and market reaction, view my work and the charts exchanged between our seasoned traders in TradingtheCharts forum . Continued success has inspired expansion of the “open access to non subscribers” forums, and our Market Advisory members and I have agreed to post our work in these forums periodically. Explore services from Wall Street's best, including Jim Curry, Tim Ords, Glen Neely, Richard Rhodes, Andre Gratian, Bob Carver, Eric Hadik, Chartsedge, Elliott today, Stock Barometer, Harry Boxer, Mike Paulenoff and others. Try them all, subscribe to the ones that suit your style, and accelerate your trading profits! These forums are on the top of the homepage at Trading the Charts.
Market analysts are always welcome to contribute to the Forum or newsletter. Email me @ Dominick@tradingthecharts.com if you have any interest.
Disclaimer - This update is provided as general information and is not an investment recommendation. TTC accepts no liability whatsoever for any losses resulting from action taken based on the contents of its charts, commentaries, or price data. Securities and commodities markets involve inherent risk and not all positions are suitable for each individual. Check with your licensed financial advisor or broker prior to taking any action.
© 2005-2022 http://www.MarketOracle.co.uk - The Market Oracle is a FREE Daily Financial Markets Analysis & Forecasting online publication.