Stock Market S&P 1,880 or Bust Again – China’s Melting Away!
Stock-Markets / Stock Markets 2014 Apr 29, 2014 - 12:34 PM GMTBy: PhilStockWorld
 What total BS this market is.
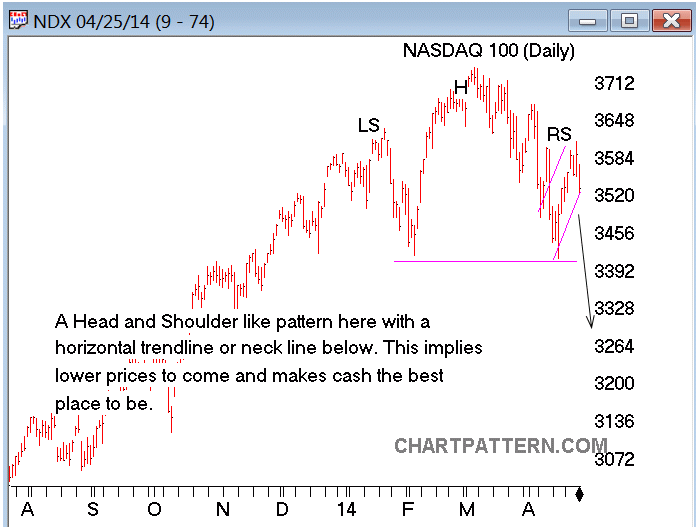
NDX fell all the way to 3,480 yesterday but finished the day at 3,556, recovering 76 points (2%) in two hours. Hey, a few more days of gains at that rate and we'll be well over the 1999 highs – GO MARKETS!!!

Of course, as you can see from this chart (many more like this over at our Chart School), it's going to take a lot more than a little 2% stick-save to stop that nasty "Head and Shoulders" pattern from hitting the dreaded "knees and toes" range.
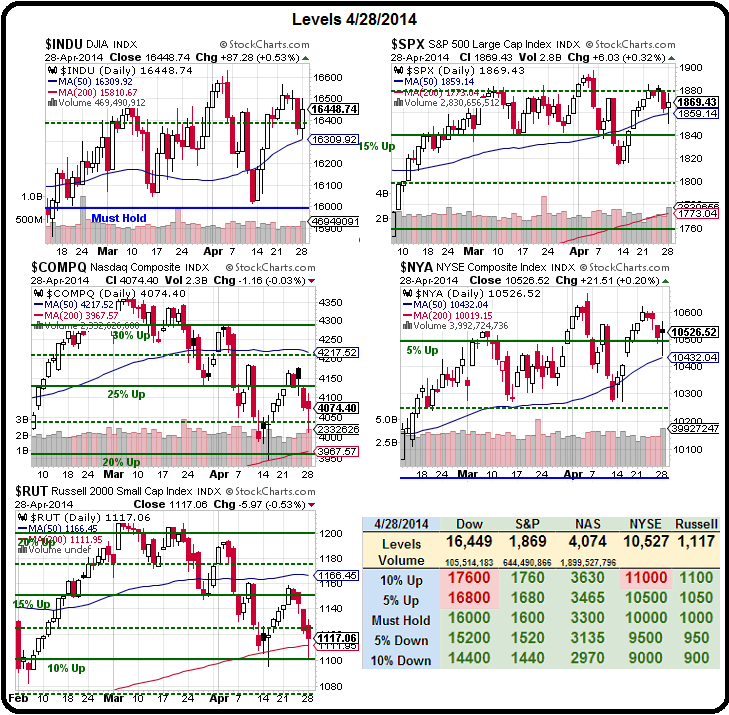
On the bright side, there was decent volume on yesterday's reversal, but that was only compared to the incredibly low volume of the previous run-ups. SPY volume was 135M, the biggest day since 4/15 by 30%+. If we do get follow-through to the upside today, we do need to take it seriously. As you can see from our Big Chart, the Nasdaq and the Russell are still in serious trouble:

The Russell was only saved by the 200 dma at 1,112 yesterday and fell all the way down to test our 10% line at 1,100, where we barely held up in February. This is what's keeping us from adjusting our 5% levels higher, the RUT keeps threatening to add a red box and the Dow simply cannot get over of it's 5% line (though it has avoided failing the Must Hold line, so far).
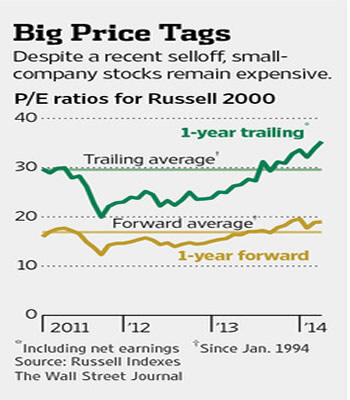
As you can see from this WSJ chart, the Russell 2000 is trading at a fairly ridiculous 36 times trailing earnings – even with the recent sell-off. Going forward, they project to be at 20 times earnings but I'm not seeing any actual evidence that profits will be rising 44% this year, are you? That's what it takes to change a 36 p/e into a 20 p/e but PLEASE – don't confuse traders with facts, right?

The 20-year average for the Russell, including the runaway valuations of 1999 and 2007, is 16.9 so 36 is more than double the average valuation. Small cap stocks (under $1Bn in valuation) aren't even benefiting from the Fed's Free Money Party the way the S&P 500 are and, in fact, they are being put at a competitive disadvantage in most markets.
The only thing Small Caps really have going for them is that the Mega-Caps have been snapping them up, especially in the Energy and Biotech sectors and it's that consolidation trend, much like in 2007, that is driving us to new highs – despite the relatively poor economic performance in the background.
How long can the madness last? Until the music stops and the Fed stops giving interest-free Trillions to their Bankster buddies who, in turn, push for M&A deals with low-cost financing and find many willing partners in the Mega Caps – as they are not able to grow their business internally in a stagnant economy.
In order to protect their phony-baloney jobs (harrumph!), large-cap CEOs are buying their own stock and the stock of their competitors – whatever they can get with the oceans of cash that are sloshing around for the top 0.01% to dip into at will.
The madness may not last much longer in China, where almost all of the Provinces failed to meet their growth targets for Q1, even after scaling back their projections. 30 of 31 (97%) reported missing goals with Heilongjiang, for example, only growing 4.1% vs an 8.5% objective. Premier Li Keqiang risks the nation sliding into a deeper slowdown as the government cracks down on overcapacity in the steel industry, wrestles with shadow banking risks and rolls out economic restructuring measures.

Six provinces missed their goals by more than 3 percentage points. In Hebei, where the government is cutting steel capacity, growth was 4.2 percent, compared with a target of 8 percent. The province surrounding Beijing is the country’s biggest steelmaker, accounting for about a quarter of national output last year, and its cities are shrouded in smog.
In Shanxi, a region hit by slumping coal prices and mine closures, an expansion of 5.5 percent compared with a full-year target of 9 percent. Heilongjiang, Hebei and Shanxi are “all provinces which suffer relatively severe overcapacity,” said Ding Shuang, senior China economist at Citigroup Inc. in Hong Kong.
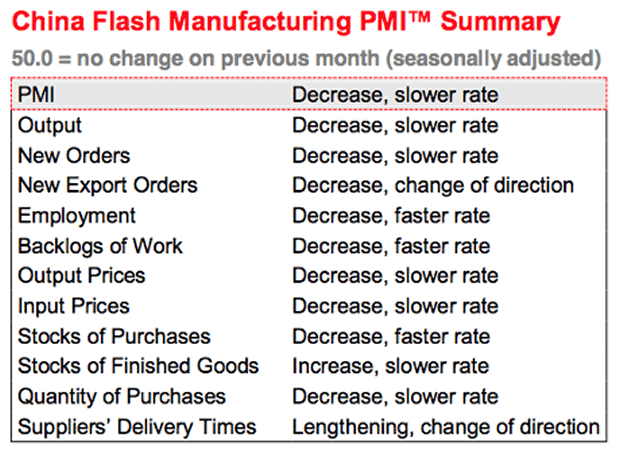
In short, China is missing their GDP targets, their manufacturing activity is slowing and they are shutting down steel production because there's a massive glut, as well as a glut of copper in warehouses. We learned in 2007 to ignore China's problems at our own risk – or did we?
Let's be careful out there.
- Phil
Philip R. Davis is a founder of Phil's Stock World (www.philstockworld.com), a stock and options trading site that teaches the art of options trading to newcomers and devises advanced strategies for expert traders. Mr. Davis is a serial entrepreneur, having founded software company Accu-Title, a real estate title insurance software solution, and is also the President of the Delphi Consulting Corp., an M&A consulting firm that helps large and small companies obtain funding and close deals. He was also the founder of Accu-Search, a property data corporation that was sold to DataTrace in 2004 and Personality Plus, a precursor to eHarmony.com. Phil was a former editor of a UMass/Amherst humor magazine and it shows in his writing -- which is filled with colorful commentary along with very specific ideas on stock option purchases (Phil rarely holds actual stocks). Visit: Phil's Stock World (www.philstockworld.com)
© 2014 Copyright PhilStockWorld - All Rights Reserved Disclaimer: The above is a matter of opinion provided for general information purposes only and is not intended as investment advice. Information and analysis above are derived from sources and utilising methods believed to be reliable, but we cannot accept responsibility for any losses you may incur as a result of this analysis. Individuals should consult with their personal financial advisors.
PhilStockWorld Archive |
© 2005-2022 http://www.MarketOracle.co.uk - The Market Oracle is a FREE Daily Financial Markets Analysis & Forecasting online publication.


