U.S. Quarterly Economic Review - Optimism at the Fed
Economics / US Economy Apr 23, 2014 - 03:48 PM GMTBy: John_Mauldin
 In today’s Outside the Box, Lacy Hunt and Van Hoisington of Hoisington Investment have the temerity to point out that since the Great Recession officially ended in 2009, the Federal Open Market Committee (FOMC) has been consistently overoptimistic in its projections of US growth. They simply expected QE to be more stimulative than it has been, to the tune of about 6% over the past four years – a total of about $1 trillion that never materialized.
Given that dismal track record, our authors ask why we should believe the Fed’s prediction of 2.9% real GDP growth for 2014 and 3.4% for 2015 – particularly with QE being tapered into nonexistence.
A big part of the reason the Fed has been so steadily wrong, say Lacy and Van, is its overreliance on the so-called “wealth effect,” which posits that an increase in consumer wealth – through higher stock prices or home values, for instance – will lead to increased consumer spending.
The wealth effect has been both a justification for quantitative easing and a root cause of consistent overly optimistic growth expectations by the FOMC. The research cited below suggests that the concept of a wealth effect is in fact deeply flawed. It is unfortunate that the FOMC has relied on this flawed concept to experiment with over $3 trillion in asset purchases and continues to use it as the basis for what we believe are overly optimistic growth expectations.
The effect isn’t completely absent, say the authors, but their research suggests that it may five to ten times weaker than the Fed assumes. Go figure.
Hoisington Investment Management Company (www.Hoisingtonmgt.com) is a registered investment advisor specializing in fixed-income portfolios for large institutional clients. Located in Austin, Texas, the firm has over $5 billion under management and is the sub-adviser of the Wasatch-Hoisington US Treasury Fund (WHOSX).
It is been a busy day for me here in Dallas. Besides nonstop meetings and conversations and my usual reading, I had the privilege of going to the Dallas branch of the Federal Reserve and watching President Richard Fisher make loans to a group of budding entrepreneurs to build lemonade stands. It is part of a fabulous organization called Lemonade Day. The basic concept is to enable young children to learn about entrepreneurship and capitalism by helping them launch a lemonade stand. Youth who register are taught 14 lessons from their entrepreneurial workbook, with either a parent, teacher, youth organization leader, or other adult mentor supervising. At the conclusions of the lessons, they are prepared to open their first business… a lemonade stand. Local businesses and banks volunteer to empower these kids by making them a $50 loan and helping them set up their business. By the time they come to talk with the “banker,” they have a business plan and a set of goals as to what they will do with them profits they make. Watching these kids respond to adults asking them about their plans brings joy to your heart.
On May 4, in some 35 cities across the country, 200,000 young people will be building lemonade stands and trying to turn a profit. If you drive by a lemonade stand, stop and support America’s future entrepreneurs. If you are in one of those 35 cities (click here to find out), make a point to find a few lemonade stands and support America’s future. And if you don’t have a lemonade stand in your city, consider following in the footsteps of local heroes (and my good friends) Reid Walker and Robert Alpert, who decided to launch Lemonade Day here in Dallas. This should be a spring ritual in every city in the country.
Buoyed by the kids and their enthusiasm, I then went to dinner with Richard Fisher and Woody Brock and a few other associates of Ray Hunt, who hosted us for a fabulous and thought-provoking session, talking economics, geopolitics, and even a little politics. There was an interesting mix of pessimism and optimism in the room about the future of our country, but there was not a person who was not concerned with the direction in which we are headed. Gerald Turner, the president of SMU, talked to us about how fiscally conservative and socially liberal his students are. That kind of mirrors my own children. The world is changing faster, both technologically and demographically, than many of us in the Boomer generation are comfortable with. But we’d better get used to it.
It’s been a tumultuous last few days, and tomorrow morning I have to leave early for San Francisco to do a video shoot with my partners at Altegris, before going right back to the airport and flying home to speak to a local group of investment advisers and brokers brought together by Peak Capital Management. It is late and time to hit the send button, because the alarm clock will go off early. Have a great week
Your wondering where all the time goes analyst,
John Mauldin, Editor
Outside the Boxsubscribers@mauldineconomics.com
Hoisington Investment Management – Quarterly Review and Outlook, First Quarter 2014
Optimism at the FOMC
The Federal Open Market Committee (FOMC) has continuously been overly optimistic regarding its expectations for economic growth in the United States since the last recession ended in 2009. If their annual forecasts had been realized over the past four years, then at the end of 2013 the U.S. economy should have been approximately $1 trillion, or 6%, larger. The preponderance of research suggests that the FOMC has been incorrect in its presumption of the effectiveness of quantitative easing (QE) on boosting economic growth. This faulty track record calls into question their latest prediction of 2.9% real GDP growth for 2014 and 3.4% for 2015.
A major reason for the FOMC’s overly optimistic forecast for economic growth and its incorrect view of the effectiveness of quantitative easing is the reliance on the so-called “wealth effect”, described as a change in consumer wealth which results in a change in consumer spending. In an opinion column for The Washington Post on November 5, 2010, then FOMC chairman Ben Bernanke wrote, “...higher stock prices will boost consumer wealth and help increase confidence, which can also spur spending. Increased spending will lead to higher incomes and profits that, in a virtuous circle, will further support economic expansion.” Former FOMC chairman Alan Greenspan in a CNBC interview on Feb. 15, 2013 said, “The stock market is the key player in the game of economic growth.” This year, in the January 20 issue of Time Magazine, the current FOMC chair, Janet Yellen said, “And part of the [economic stimulus] comes through higher house and stock prices, which causes people with homes and stocks to spend more, which causes jobs to be created throughout the economy and income to go up throughout the economy.”
FOMC leaders may feel justified in taking such a position based upon the FRB/US, a large- scale econometric model. In part of this model, employed by the FOMC in their decision making, household consumption behavior is expressed as a function of total wealth as well as other variables. The model predicts that an increase in wealth of one dollar will boost consumer spending by five to ten cents (see page 8-9 “Housing Wealth and Consumption” by Matteo Iacoviello, International Finance Discussion Papers, #1027, Board of Governors of the Federal Reserve System, August 2011). Even at the lower end of their model's range this wealth effect, if it were valid, would be a powerful factor in spurring economic growth.
After examining much of the latest scholarly research, and conducting in house research on the link between household wealth and spending, we found the wealth effect to be much weaker than the FOMC presumes. In fact, it is difficult to document any consistent impact with most of the research pointing to a spending increase of only one cent per one dollar rise in wealth at best. Some studies even indicate that the wealth effect is only an interesting theory and cannot be observed in practice.
The wealth effect has been both a justification for quantitative easing and a root cause of consistent overly optimistic growth expectations by the FOMC. The research cited below suggests that the concept of a wealth effect is in fact deeply flawed. It is unfortunate that the FOMC has relied on this flawed concept to experiment with over $3 trillion in asset purchases and continues to use it as the basis for what we believe are overly optimistic growth expectations.
Consumer Wealth and Consumer Spending
Many episodes of rising and falling financial and housing asset wealth have occurred throughout history. The question is whether these periods of wealth changes are associated in a consistent and reliable way with changes in consumer spending. We examined, separately, percent changes in real consumption expenditures per capita against percent changes in the real S&P 500 index (financial wealth) and against percent changes in Robert Shiller’s real home price index (housing wealth). If economic relationships are valid they should work for all time periods, regardless of highly different idiosyncratic conditions, as opposed to an isolated subset of historical experience. As such, we conducted our analysis from 1930 through 2013, the entire time period for which all variables were available.
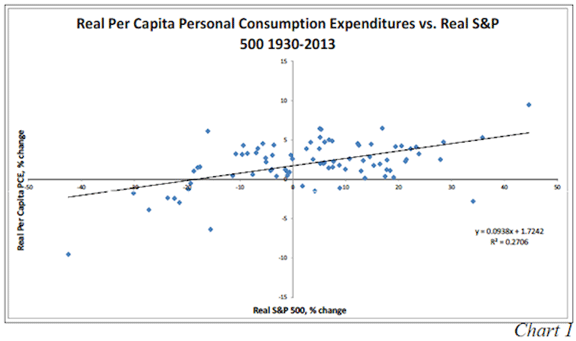
Financial Wealth. Chart 1 is a scatter diagram of current percent changes in both real per capita personal consumption expenditures (PCE), the preferred measure of spending, and the real S&P 500 stock price index. It is made up of 84 dots, which constitutes a robust sample. Over our sample period, as with most extremely long periods, time will tend to link economic variables to each other; population is a key factor that can cause such an association. By expressing consumption in per capita terms, trending has been reduced, and in turn, an artificially overstated degree of correlation has been avoided.

If financial wealth drives consumer spending, an unambiguous positively sloped line should be evident on this scatter diagram. Larger gains in the S&P 500 would be associated with faster increases in spending; conversely, declines in the S&P 500 would be tied to lower spending. If there was a strong positive correlation, the large gains in stock prices would be associated with strong gains in spending, and they would fall in the upper right quadrant of the graph. In addition, sizeable declines in the S&P would be associated with large decreases in consumer spending, and the dots would fall in the lower left quadrant, resulting in an upward sloping line. For the relationship to be stable and dependable the dots should be packed in an around the trend line. This is clearly not the case. The trend line through the dots is positive, but the observations in the upper left quadrant of the graph and those in the lower right exhibit a negative rather than positive correlation. Furthermore, the dots are not clustered close to the trend line. The goodness of fit (coefficient of determination) of 0.27 is statistically significant; however, the slope of the line is minimally positive. This suggests that an approximate one dollar increase in wealth will boost real per capita PCE by less than one cent, far less than even the lower band of the effect in the Fed’s model.
Theoretically, lagged changes are preferred because when current or coincidental changes in economic variables are correlated the coefficients may be biased due to some other factor not covered by the empirical estimation. Also, lags give households time to adjust to their change in wealth. As such, we correlated the current percent change in real per capita PCE against current changes as well as one- and two-year lagged changes (expressed as a three-year moving average) in the S&P 500. The lags did not improve the goodness of fit as the coefficient of determination fell to 0.21. An increased dollar of wealth, however, still resulted in a one cent increase in consumption. We then correlated current percent change in real per capita PCE with only lagged changes in the real S&P 500 for the two prior years (expressed as a two-year moving average), and the relationship completely fell apart as the goodness of fit fell to a statistically insignificant 0.06.
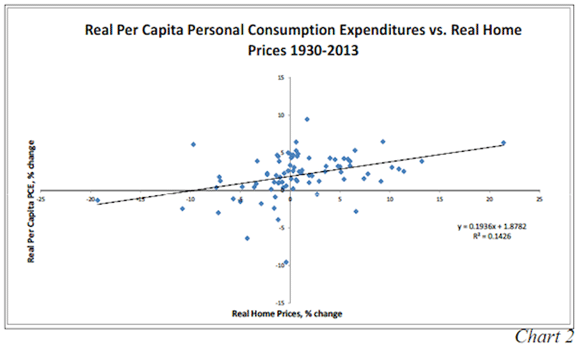
Housing Wealth. Chart 2 is a second scatter diagram, relating current percent changes in real home prices to current percent changes in real per capita PCE. Once again, the trend line does have a small positive slope, but there are so many observations in the upper left quadrant that the coefficient of determination does not meet robust tests for statistical significance. The dots are even more dispersed from the trend line than in the prior scatter diagram.

As with the analysis on financial wealth, when current changes in consumption were correlated against the lagged changes in home prices (both the three-year moving average and the two-year moving average), the goodness of fit deteriorated significantly and was not statistically significant in either case.
Correlations, or the lack thereof, indicated by these scatter diagrams do not prove causation. Nevertheless, economic theory offers an explanation for the poor correlation. If a person has an appreciated asset and wishes to increase spending, one option is to sell the asset, capture the gain and buy something else. However, the funds to make the new purchase comes from the buyer of the asset. Thus, when financial assets are sold, money balances increase for the seller but fall for the buyer. The person with an appreciated asset could choose to borrow against that asset. Since new debt is current spending in lieu of future spending, the debt option may only provide a temporary boost to economic activity. To avoid an accentuated business cycle, debt must generate an income stream to repay principal and interest. Otherwise any increase in debt to convert wealth gains into consumer spending may merely add to cyclical volatility without producing any lasting benefit.
Scholarly Research
Scholarly research has debated the impact of financial and housing wealth on consumer spending as well. The academic research on financial wealth is relatively consistent; it has very little impact on consumption. In “Financial Wealth Effect: Evidence from Threshold Estimation” (Applied Economic Letters, 2011), Sherif Khalifa, Ousmane Seck and Elwin Tobing found “a threshold income level of almost $130,000, below which the financial wealth effect is insignificant, and above which the effect is 0.004.” This means a one dollar rise in wealth would, in time, boost consumption by less than one-half of a penny. Similarly, in “Wealth Effects Revisited 1975- 2012,” Karl E. Case, John M. Quigley and Robert J. Shiller (Cowles Foundation Discussion Paper #1884, December 2012) write, “The numerical results vary somewhat with different econometric specifications, and so any numerical conclusion must be tentative. We find at best weak evidence of a link between stock market wealth and consumption.” This team looked at quarterly observations during the 17-year period from 1982 through 1999 and the 37-year period from 1975 through the spring quarter of 2012.
The research on housing wealth is more divided. In the same paper referenced above, Karl E. Case, John M. Quigley and Robert J. Shiller write, “In contrast, we do find strong evidence that variations in housing market wealth have important effects upon consumption.” These findings differ from the findings of various other economists. In “The (Mythical?) Housing Wealth Effect” (NBER Working Paper #15075, June 2009), Charles Calomiris, Stanley D. Longhofer and William Miles write, “Models used to guide policy, as well as some empirical studies, suggest that the effect of housing wealth on consumption is large and greater than the wealth effect on consumption from stock holdings. Recent theoretical work, in contrast, argues that changes in housing wealth are offset by changes in housing consumption, meaning that unexpected shocks in housing wealth should have little effect on non- housing consumption.”
Furthermore, R. Glenn Hubbard and Anthony Patrick O’Brien (Macroneconomics, Fourth edition, 2013, page 381) provide a highly cogent summary of the aforementioned research by Charles Calomiris, Stanley D. Longhofer and William Miles. They argue that consumers “own houses primarily so they can consume the housing services a home provides. Only consumers who intend to sell their current house and buy a smaller one – for example, ‘empty nesters’ whose children have left home – will benefit from an increase in housing prices. But taking the population as a whole, the number of empty nesters may be smaller than the number of first time home buyers plus the number of homeowners who want to buy larger houses. These two groups are hurt by rising home prices.”
Amir Sufi, Professor of Finance at the University of Chicago, also indicates that the effect of housing wealth is much smaller than assumed in the policy models and earlier empirical research. Dr. Sufi calculates that an increase of one dollar of housing wealth may yield as little as one cent of extra spending (“Will Housing Save the U.S. Economy?”, April 2013, Chicago Booth Economic Outlook event). This is in line with a 2013 study by Sherif Khalifa, Ousmane Seck and Elwin Tobing (“Housing Wealth Effect: Evidence from Threshold Estimation”, The Journal of Housing Economics). These economists found that a threshold income level of $74,046 had a wealth coefficient that rounded to one cent. Income levels between $74,046 and $501,000 had a two cent coefficient, and incomes above $501,000 had a statistically insignificant coefficient.
In total, the majority of the research is seemingly unequivocal in its conclusion. The wealth effect (financial and housing) is barely operative. As such, it is interesting to note its actual impact in 2013.
Where Was the Wealth Effect in 2013?
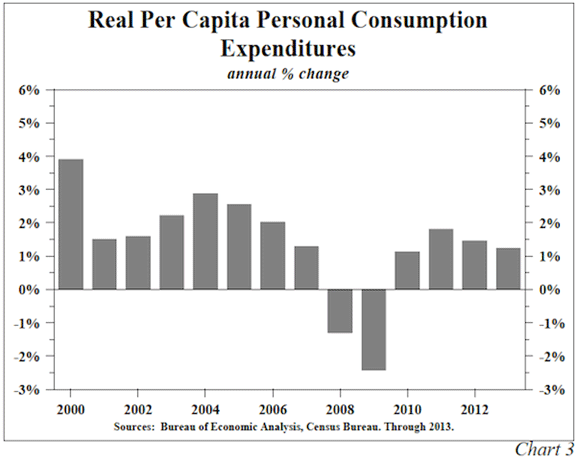
If the wealth effect was as powerful as the FOMC believes, consumer spending should have turned in a stellar performance last year. In 2013 equities and housing posted strong gains. On a yearly average basis, the real S&P 500 stock market index increase was 17.7%, and the real Case Shiller Home Price Index increase was 9.1%. The combined gain of these wealth proxies was 26.8%, the eighth largest in the 84 years of data. The real per capital PCE gain of just 1.2% ranked 58th of 84. The difference between the two was the fifth largest in the 84 cases. Such a huge discrepancy in relative performance in 2013, occurring as it did in the fourth year of an economic expansion, raises serious doubts about the efficacy of the wealth effect (Chart 3).

In econometrics, theoretical propositions must be empirically verifiable. Researchers using numerous statistical procedures examining various sample periods should be able to identify at least some consistent patterns. This is not the case with the wealth effect. Regardless if examining a simple scatter diagram or something far more sophisticated, the wealth effect is weak and inconsistent. The powerful wealth coefficients imbedded in the FRB/US model have not been supported by independent research. To quote Chris Low, Chief Economist of FTN (FTN Financial, Economic Weekly, March 21, 2014), “There may not be a wealth effect at all. If there is a wealth effect, it is very difficult to pin down ...” Since the FOMC began quantitative easing in 2009, its balance sheet has increased more than $3 trillion. This increase may have boosted wealth, but the U.S. economy received no meaningful benefit. Furthermore, the FOMC has no idea what the ultimate outcome of such an increase will be or what a return to a ‘normal’ balance sheet might entail. Given all of this, we do not see any evidence for economic growth as robust at the FOMC predicts.
Without a wealth effect, the stock market is not the “key player” in the economy, and no “virtuous circle” runs through the stock market. We reiterate our view that nominal GDP will rise just 3% this year, down from 3.4% in 2013. M2 growth in the latest twelve months was 5.8%, but velocity should decline by at least 3% and limit nominal GDP to 3% or less.

The Flatter Yield Curve: An Opportunity for Treasury Bond Investors
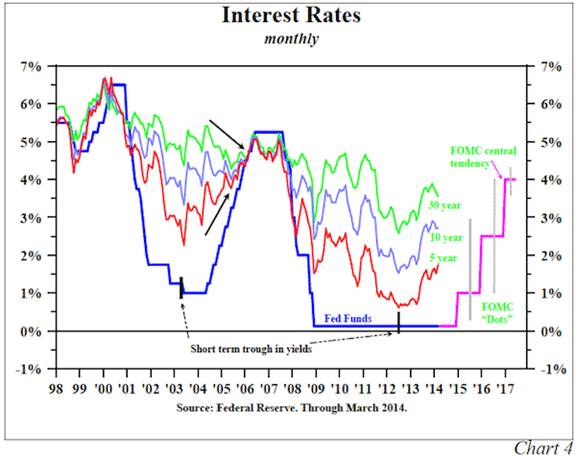
The Fed has indicated that the federal funds rate could begin to rise in the next couple of years, and the Treasury market has moderately anticipated this event. Similar to the 2004-2005 federal funds rate cycle, long before the federal funds rate increased short Treasury rates began their ascent (Chart 4). Interestingly, once the federal funds rate did begin to rise in 2004, long Treasury rates fell over the next two years. From May of 2004 until Feb. 2006 the federal funds rate increased by 350 basis point (bps) and the five-year note increased by 80 bps, yet the 30-year bond fell by 84 bps as inflation expectations fell. If the Fed follows through with its forecast and short rates rise, the dampening effect on inflation expectations should again cause long rates to fall. On the other hand, should economic activity continue to moderate then the downward pressure on inflation will continue. The prospect for lower Treasury yields appears favorable.
Van R. Hoisington
Lacy H. Hunt, Ph.D.
Like Outside the Box?
Sign up today and get each new issue delivered free to your inbox.
It's your opportunity to get the news John Mauldin thinks matters most to your finances.
John Mauldin Archive |
© 2005-2022 http://www.MarketOracle.co.uk - The Market Oracle is a FREE Daily Financial Markets Analysis & Forecasting online publication.


