Canadian Stock Market - Bear Market has Possibly Begun - TSX - Elliott Wave Analysis
Stock-Markets / Canadian Stock Market Mar 04, 2007 - 04:42 PM GMTBy: Francois_Soto
 Wow! What a day!
The sharp sell off today in all sorts of equities following the plunge in Asia is slowly confirming that the mood of market participants is now changing from greed to fear. A day like we experienced today is a precursor sign that we are now entering a bear market of larger degree. In this report, we will check what is going on using the Elliott Wave Theory.
To simplify the analysis below, we will only take a look at Canadian equities because we believe the TSX index is by far the easiest to analyze no matter the time frame we are looking at due to the very classical and simplistic patterns it made in the past. In other words, it is less complex than indexes tracking the American equities such as the SPX, INDU and COMPQ but yet still reflects what happens down the border and worldwide.
Current Count
The TSX fully completed its minor wave C of secondary (5) of primary [5] of cycle I of possibly supercycle (III). The TSX now has begun cycle II of supercycle (III). This would be the fourth bear market of significant magnitude since the early 80's: 1981, 1987, 2000 and now 2007. The graph below displays the long term perspective (30 years):
Long Term Picture of TSX
The picture is oversized. Please click the link here!
The last time the TSX suffered from a cycle II was in 1981. During that period, volatility was high and the correction took the shape of a simple zig-zag that retraced exactly 61.8% of cycle I. A zig-zag is a short time framed correction and it usually retraces alot of the initial movement.
It is uncertain the type of correction pattern the 2007 cycle II will unfold. However, it should be guessed as a regular zig-zag again (like in the 1981 cycle II) because that's usually the typical “textbook” figure for most second waves. However, we all know the market got more tricks in its bag than we may think!
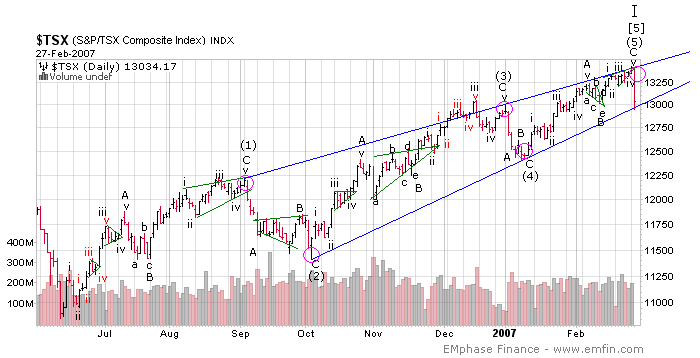
Now to come back to the short term perspective (1 year), we had a target between 13 400 and 14 000 points for that last minor wave C but it finally took the shape of small ending diagonal and it reached only the minimal target with its last daily high made the 26th February at 13 433 points. Today, price broke this small ending diagonal.
Short Term Picture of TSX

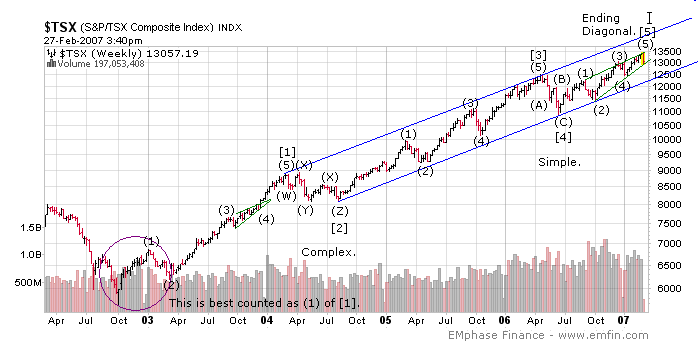
On the medium term perspective (5 years), the primary [5] of cycle I took the shape of a very large ending diagonal pattern. An Ending diagonal is basically a “wedge” appearing either in the last wave of a bull market (wave 5) or the last wave of a bear market (wave C). In this figure, each secondary wave is made of 3 waves making it a 3-3-3-3-3 formation.
Medium Term Picture of TSX

Conclusion
So what can we expect in a short term perspective? We have to take a look at the 13 000 points support on the TSX. We expect it to be tested tomorrow and most likely broken. If this support fails, the large primary [5] of cycle I wedge would officially be broken also and this would only confirm the validity of this whole scenario.
Margin calls should have an impact on the market tomorrow, retail investors may panic and the TSX index may point lower in the next days. However, we can't discard the possibility of a bull trap rally either.
Moreover, we have to keep in mind that a lot of Chinese stocks were halted after they reached -10.0% losses. Chinese investors who were unable to sell their shares may dump them and this would push both the Shanghai and Shenzhen indexes lower. This would obviously have an impact both on Canadian and American equities tomorrow.
How to reduce exposure in these potentially dangerous markets? Defensive positions such as consumer staples, cash and bonds would usually be recommended. For investors that are not able to short, there are now new exchange traded funds that are replicating popular indexes but the reverse of them and with a double leverage. Such ETF's are: HXD.to (short TSX twice), QID (short COMPQ twice), SDS (short SPX twice) and DXD (short INDU twice).
Be careful!
By Francois Soto, President
EMphase Finance
www.emfin.com
© EMphase Finance. All rights reserved.
EMphase Finance strives to become one of the most important website in North America concerning fundamental analysis using traditionnal quantitative and technical analysis based on the Elliott Wave Principle. The website will contain detailed analysises concerning specific companies, commodities and indexes along with educational content.
© 2005-2022 http://www.MarketOracle.co.uk - The Market Oracle is a FREE Daily Financial Markets Analysis & Forecasting online publication.


