


British Pound GBP/USD - Double Top or Further Rally?
Currencies / British Pound Apr 11, 2014 - 10:04 AM GMTBy: Nadia_Simmons

 Earlier today, the greenback moved higher against the British pound after better-than-expected jobless claims data, which showed that the number of people filing for initial jobless benefits in the week ending April 4 declined to an almost seven year low. Will this drop in British currency trigger a bigger correction? What is the technical picture of cable? We invite you to read our today's Forex Trading Alert.
In our opinion, the following forex trading positions are justified - summary:
- EUR/USD: none
- GBP/USD: short (stop-loss order: 1.6855)
- USD/JPY: none
- USD/CAD: none
- USD/CHF: none
- AUD/USD: none
EUR/USD
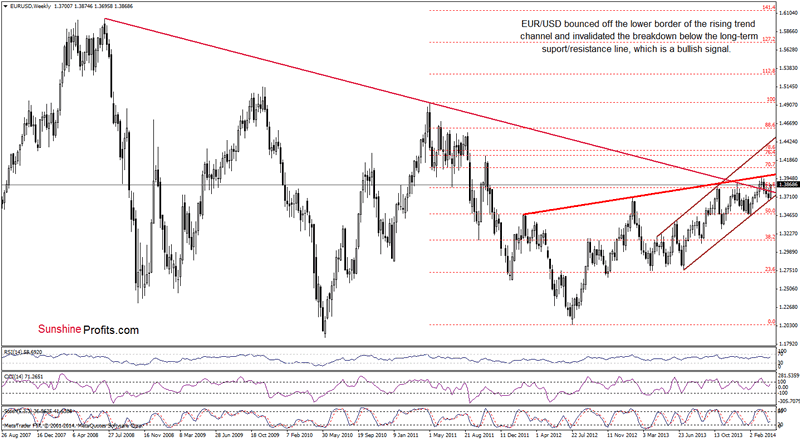
Looking at weekly chart, we see that EUR/USD bouced off the lower border of the rising trend channel (marked with brown) and came back above the long-term declining resistance line - at least for now. As a reminder, invalidation of the breakdown is a strong bullish signal that suggests further improvement. Despite these positive circumstances, the common currency remains below the 2014 high and the rising resistance line (marked with red), which succesfully stopped growth in the previous month.
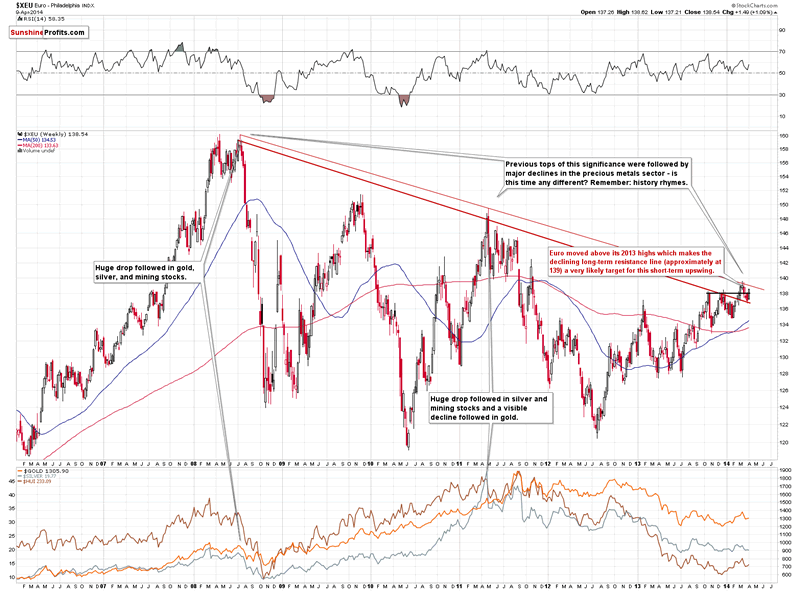
However, if we take a look at the Euro Index - which is based on slightly different prices, we get a very different picture. We have discussed this chart in today's Gold & Silver Trading Alert:
The situation is clearer today, as the 2013 highs have been surpassed. Now it seems likely that the rally will be stopped by the declining long-term resistance line, just like it was the case about a month ago.
We will be looking for confirmations along the way, but at this time our best guess is that the Euro Index will rally to the 139 level or close to it (a move to the March high is not out of the question) (...).
What does the above mean? That the breakout from the first chart is not confirmed and the breakout above the long-term resistance line is not really significant just yet. Moreover, even if we focus on the first chart alone, we have to note that the previous "breakout" was seen in March and it was followed by its quick invalidation and visible declins. We could very well be seeing a similar pattern shortly.
Are there any important short-term resistance levels which could stop buyers before reaching the annual high? Let's take a look at the daily chart.
In our last Forex Trading Alert, we wrote the following:
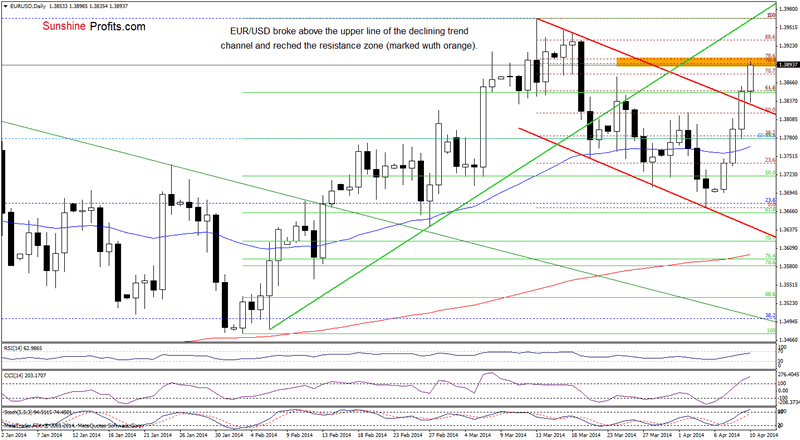
(...) taking into account the current position of the indicators (buy signals remain in place), it seems that we may see further improvement in the coming day (or days). If this is the case, the next upside target for the buyers will be the upper line of the declining trend channel (currently around 1.3843).
As you see on the above chart, the buyers not only pushed EUR/USD above the this resistance line, but also above the resistance level based on the March 24 high and the 70.7% Fibonacci retracement. From this perspective, we see that the exchange rate reached the resistance zone created by the 76.4% and 78.6% Fibonacci retracements (around 1.3896-1.3900). If it is broken, we may see further improvement and an increase to the previously-broken green resistance line, which currently almost intersects the 2014 high. However, if this resistance area encourages sellers to act, we may see a pullback in the coming days and the first downside target will be the upper line of the declining trend channel (which serves as support at the moment).
Since there were only daily rallies in the past 4 days, it seems that a correction here is more likely. This correction can - and likely will - translate into a reversal on the long-term chart and quite possibly lead to greater declines.
Very short-term outlook: mixed Short-term outlook: bearish MT outlook: bearish LT outlook: bearish
Trading position: In our opinion no positions are justified from the risk/reward perspective. We are not opening short positions just yet, because of the divergence on the long-term charts, however we will quite likely open it once we see some kind of confirmation.
GBP/USD
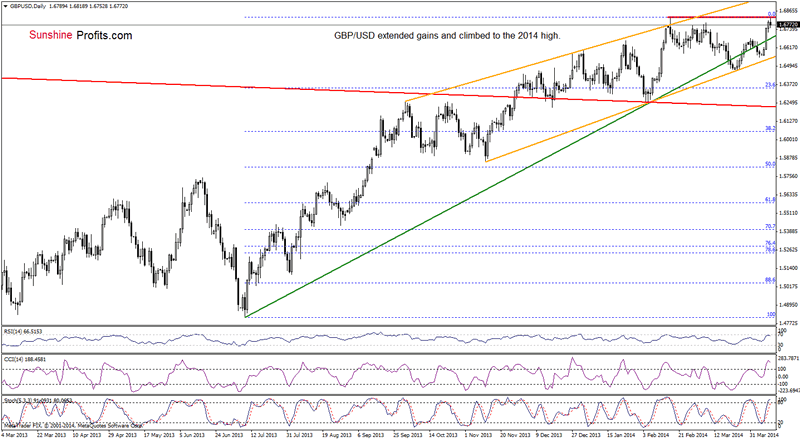
On the daily chart, we see that the situation has improved significantly as GBP/USD broke above the resistance zone created by the 76.4% and 78.6% Fibonacci retracements (based on the recent entire decline). This positive event triggered further improvement and the exchange rate reached the 2014 high earlier today. If this strong resistance level holds, we will likely see a bearish double top pattern. In this case, the initial downside target will be the medium-term rising green line (currently around 1.6676). If it is broken, we may see a drop to the lower border of the orange rising trend channel (around 1.6550), which corresponds to the April low. Nevertheless, if the buyers do not give up and push the pair above the 2014 high, we may see an increase to the upper line of the trend channel (around 1.6962) or even to the 2009 high (around 1.7040). Please note that the current position of the indicators suggests that correction is just around the corner (the RSI declined from the level of 70, while the CCI and Stochastic Oscillator are overbought).
Very short-term outlook: mixed Short-term outlook: bearish MT outlook: bearish LT outlook: mixed
Trading position (short-term): In our opinion short positions (full) are justified from the risk/reward perspective at the moment with stop-loss order at 1.6855. Please note that if GBP/USD breaks above the 2014 high (and stop-loss order works), we'll consider opening short positions around the 2009 high.
USD/JPY
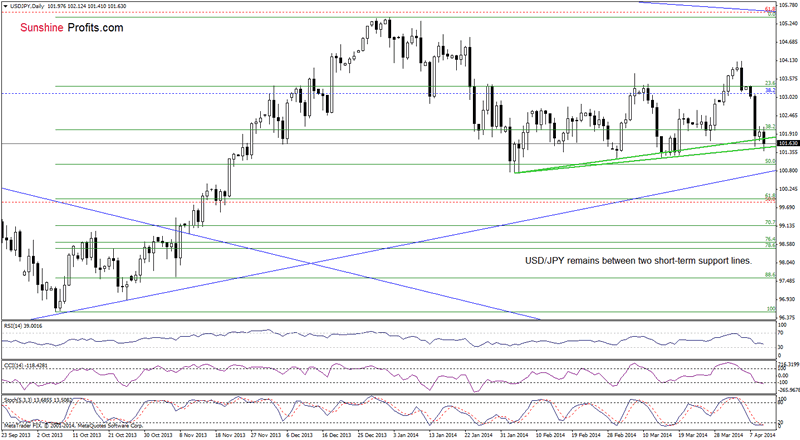
On the daily chart, we see that USD/JPY extended losses and (very temporarily - at least at the moment when these word are written) broke below the lower green support line. Therefore, what we wrote in our previous Forex Trading Alert is still up-to-date.
(...) if this support is broken, we will likely see a drop to the March 14 low or even to the February low. Please note that sell signals remain in place, supporting sellers.
Very short-term outlook: bearish Short-term outlook: mixed with bearish bias MT outlook: bullish LT outlook: bearish
Trading position (short-term; our opinion): In our opinion no positions are justified from the risk/reward perspective at the moment.
USD/CAD
Quoting our last Forex Trading Alert:
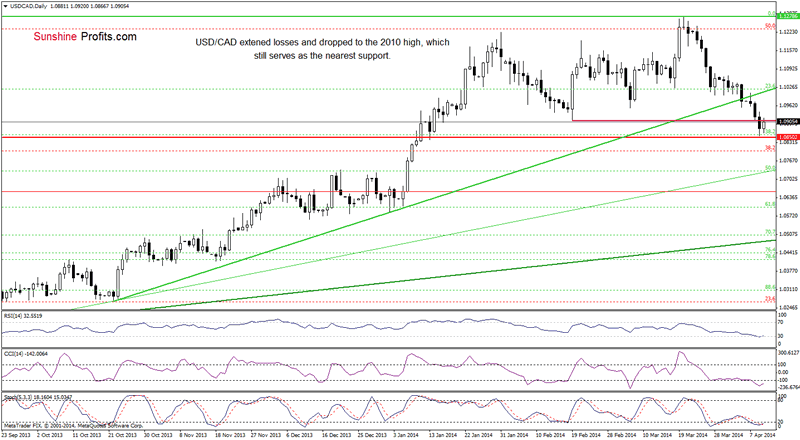
(...) the exchange rate reached its first downside target - the Feb.19 low (1.0909). (...) if it is broken, the next target for the sellers will be the horizontal red support line created by the May 2010 high (around 1,0850).
As you see on the above chart, the sellers realized their bearish scenario as USD/CAD declined to the red support line yesterday. If this strong support holds and encourages buyers to act, we may see a corrective upswing to the previously-broken green support line (around 1.1009). Please note that this scenario is reinforced by the current position of the indicators (the RSI bounced off the level of 30, while the CCI and Stochastic Oscillator are close to generating buy signals).
Very short-term outlook: mixed with bullish bias Short-term outlook: mixed MT outlook: bullish LT outlook: bearish
Trading position (short-term; our opinion): In our opinion no positions are justified from the risk/reward perspective at the moment.
USD/CHF
On Tuesday, we wrote the following:
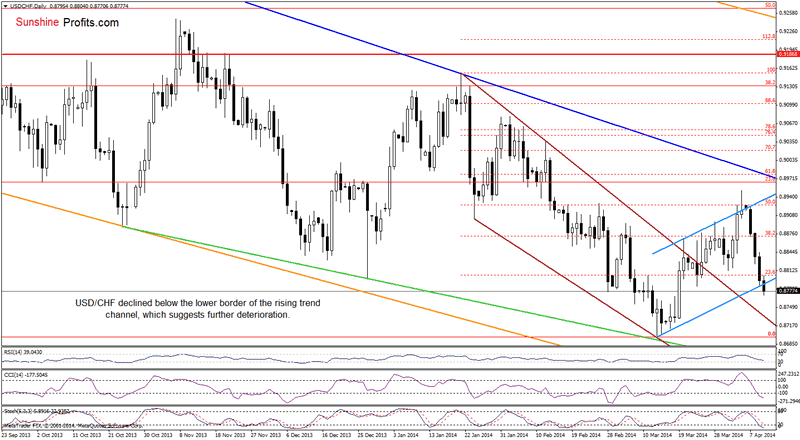
(...) USD/CHF also extended declines and reached the first downside target - the 50% Fibonacci retracement (based on the recent increase). (...) if it is broken, we will likely see a drop to the next Fibonacci retracement (around 0.8794) or even to the lower line of the blue rising trend channel (currently around 0.8781). Please note that the current position of the indicators still favors sellers.
From today's point of view, we see that the sellers not only realized this scenario, but also pushed the exchange rate below the lower border of the blue rising trend channel, which is a bearish signal that suggests further deterioration. In this case, the nearest support is the declining brown line (which is also the upper line of the declining trend channel). Taking into account the current position of the indicators (the RSI approached the level of 30, while the CCI and Stochastic Oscillator are oversold), it seems that this line may pause declines in the near future). However, if it is broken, we will see a test of the strength of the March low.
Very short-term outlook: bearish Short-term outlook: bearish MT outlook: bearish LT outlook: bearish
Trading position (short-term; our opinion): In our opinion no positions are justified from the risk/reward perspective at the moment.
AUD/USD
Quoting our last Forex Trading Alert:
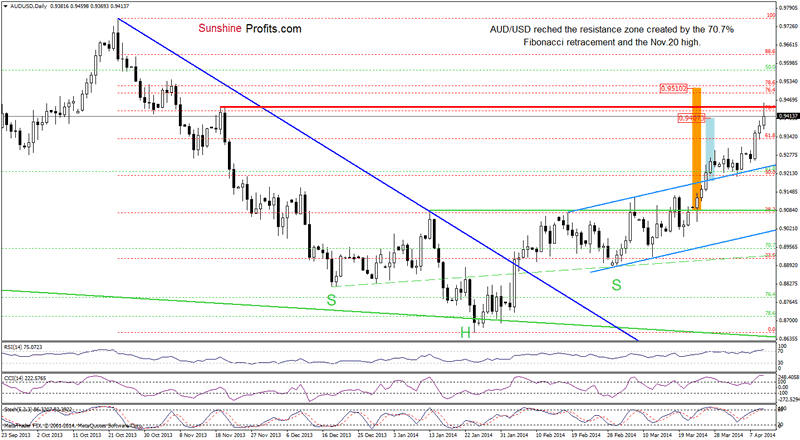
(...) we may see an increase to the next upside target (after a breakout above the upper line of the rising trend channel) around 0.9407. However, we should keep in mind that the RSI and CCI are overbought, which may trigger a pullback in the coming day (or days).
As you see on the daily chart, the buyers not only realized this scenario, but also pushed AUD/USD to the resistance zone created by the 70.7% Fibonacci retracement (based on the entire Oct.-Jan. decline). Taking this fact into account, we should consider two scenarios. On one hand, if this resistance area holds, we may see a pullback in the coming days. In this case, the downside target for the sellers will be the previously-broken upper line of the trend channel. However, if the resistance zone is broken, we will likely see an increase to around 0.9510, where the price target for the reverse head and shoulders pattern is (we wrote about this formation in our Forex Trading Alert posted on March 26). Looking at the current position of the indicators, we see that they are overbought, which suggests that correction is just around the corner.
Very short-term outlook: bullish Short-term outlook: bullish MT outlook: bearish LT outlook: bearish
Trading position (short-term; our opinion): In our opinion no positions are justified from the risk/reward perspective at the moment.
Thank you.
Nadia Simmons
Sunshine Profits‘ Contributing Author
Oil Investment Updates
Oil Trading Alerts
* * * * *
Disclaimer
All essays, research and information found above represent analyses and opinions of Nadia Simmons and Sunshine Profits' associates only. As such, it may prove wrong and be a subject to change without notice. Opinions and analyses were based on data available to authors of respective essays at the time of writing. Although the information provided above is based on careful research and sources that are believed to be accurate, Nadia Simmons and his associates do not guarantee the accuracy or thoroughness of the data or information reported. The opinions published above are neither an offer nor a recommendation to purchase or sell any securities. Nadia Simmons is not a Registered Securities Advisor. By reading Nadia Simmons’ reports you fully agree that he will not be held responsible or liable for any decisions you make regarding any information provided in these reports. Investing, trading and speculation in any financial markets may involve high risk of loss. Nadia Simmons, Sunshine Profits' employees and affiliates as well as members of their families may have a short or long position in any securities, including those mentioned in any of the reports or essays, and may make additional purchases and/or sales of those securities without notice.
© 2005-2022 http://www.MarketOracle.co.uk - The Market Oracle is a FREE Daily Financial Markets Analysis & Forecasting online publication.