Dow Stock Market Double Top - Fib or Fact?
Stock-Markets / Stock Markets 2014 Apr 09, 2014 - 12:47 PM GMTBy: Ed_Carlson
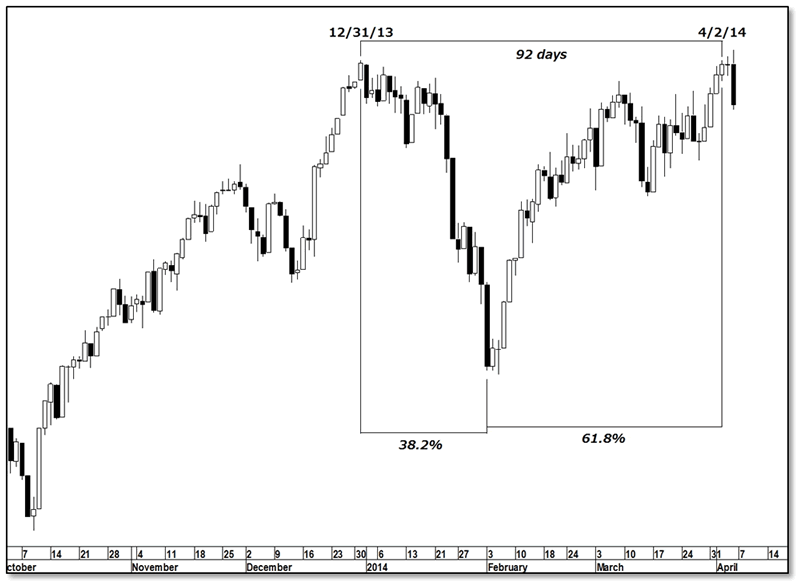
As of last Wednesday, the Dow has printed a double top. The time span between 12/31/13 and Wednesday’s closing high is 92 days. A Fibonacci 38.2% of the distance between those two dates is 35 days and 35 days past 12/31/13 marked the closing low on 2/3/14.
In the weeks and months to come, the monthly Lindsay Report will spill a lot of ink to compare the current long cycle from 2002 and the 1921-1942 long cycle. After the high on 9/3/29 the market fell to a low on 11/13/29 before a 5-month rally which topped on 4/17/30. Those who thought the drop in 1929 was horrific didn’t have the imagination to comprehend what was to come after April 1930. Similar to the 2/3/14 low, the low on 11/13/29 was 38.2% of the distance between the two highs in September 1929 and April 1930.
Lindsay described the period between the highs in 1929 and 1930 as a Sideways Movement. In the Lindsay literature a Sideways Movement is normally a topping formation in a bull market with both highs at, or near, the same level. In this case, the Dow printed a double top only in theory. In our current situation a double top looks for real. Fib or Fact?

Get your copy of the March Lindsay Report at SeattleTA.
Want to know more about the work of George Lindsay? Order your own copy of the George Lindsay Training Course at SeattleTA.
Ed Carlson, author of George Lindsay and the Art of Technical Analysis, and his new book, George Lindsay's An Aid to Timing is an independent trader, consultant, and Chartered Market Technician (CMT) based in Seattle. Carlson manages the website Seattle Technical Advisors.com, where he publishes daily and weekly commentary. He spent twenty years as a stockbroker and holds an M.B.A. from Wichita State University.
© 2014 Copyright Ed Carlson - All Rights Reserved
Disclaimer: The above is a matter of opinion provided for general information purposes only and is not intended as investment advice. Information and analysis above are derived from sources and utilising methods believed to be reliable, but we cannot accept responsibility for any losses you may incur as a result of this analysis. Individuals should consult with their personal financial advisors.
© 2005-2022 http://www.MarketOracle.co.uk - The Market Oracle is a FREE Daily Financial Markets Analysis & Forecasting online publication.


