


Final Bubble Phase for the Stock Market: Final Capitulation for Gold
Stock-Markets / Financial Markets 2014 Apr 08, 2014 - 06:21 PM GMTBy: Toby_Connor

 After two hard days down in the stock market I'm going to take a contrary position and say that this is just a normal profit taking event and that stocks are going to recover and head back up to new highs. I still think this market needs to have a final blow off bubble phase before the bull can die. The final bubble phase for stocks should usher in the final capitulation stage of gold's 2 1/2 year bear market. For those like SMT subscribers that are sitting in cash, this final capitulation is going to represent one of the greatest buying opportunities of this generation.
First off let's take a look at the stock market:
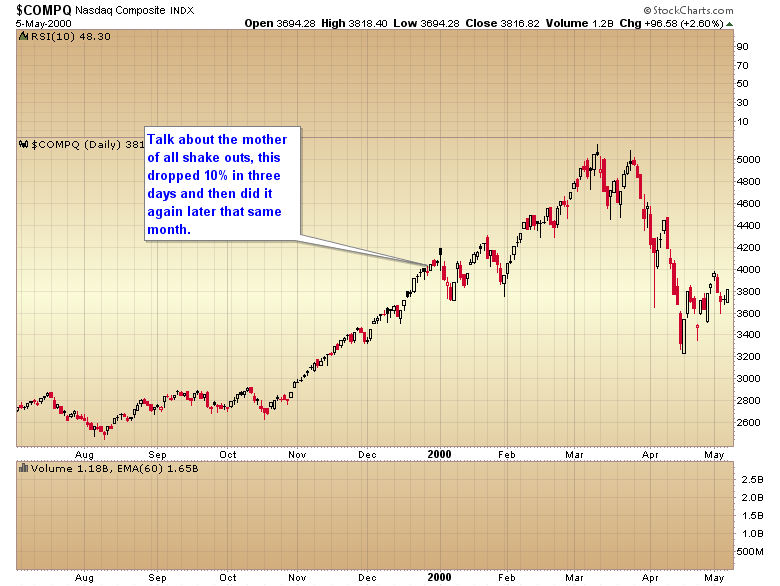
We've had so many calls for a crash over the last year that you just know the bears are salivating right now thinking they are finally going to get their wish. However, I don't think we can have a crash in the stock market until we complete a true parabolic structure. Notice that during the final parabolic move in 2000 the NASDAQ had two back-to-back 10% corrections, one of them unfolding in only three days and completing what looked like at the time a double top. The shorts that jumped in at the bottom of that second 10% correction then got absolutely destroyed over the next six weeks as the tech sector proceeded to rally 34%.
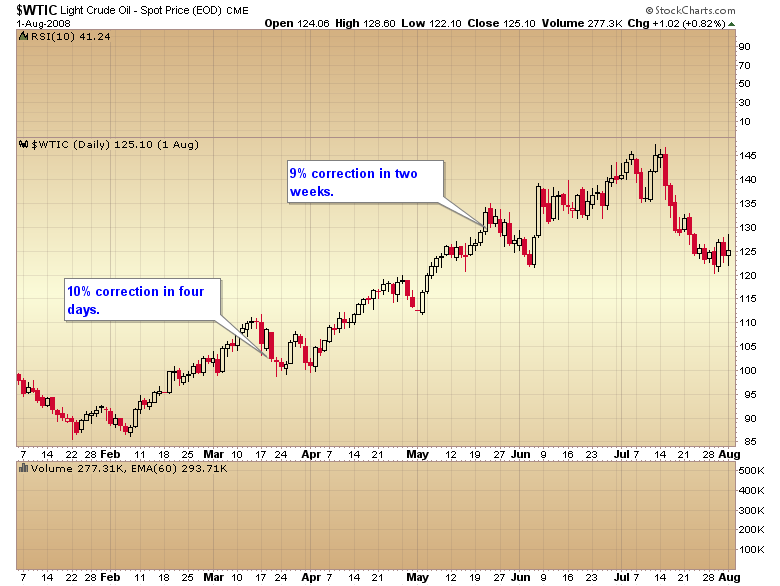
We saw a very similar pattern during oil's parabolic advance in 2008 - two very convincing 10% corrections followed by a 5 to 6 week surge into a final top.
The fashionable call right now is that the big momentum names like Facebook, Priceline, Tesla, Netflix, etc. are leading the market into a new bear. I on the other hand think these stocks are just pulling back in preparation for one final mind blowing surge to top off this five-year bull market.
Gold on the other hand looks like it is setting up for a final bear market capitulation phase where every gold bug finally throws up their hands in disgust and jumps over to the stock market right as it's putting in a final bubble top.
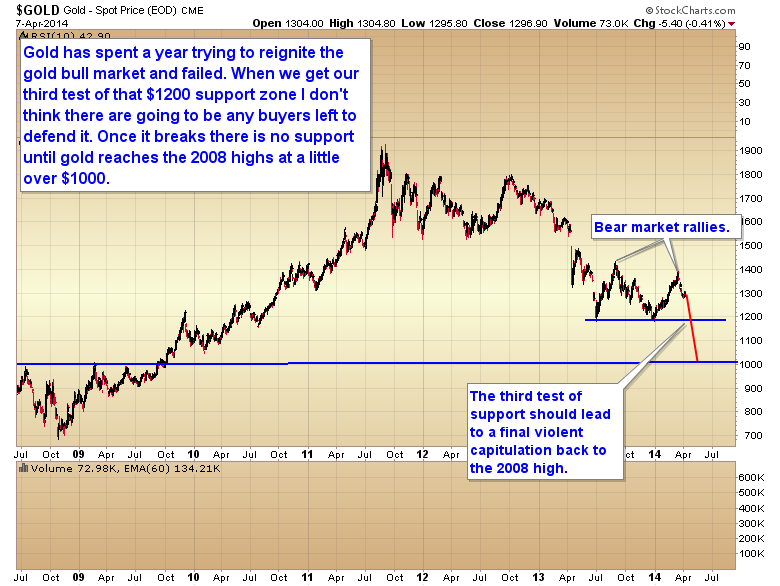
It's now been a year since gold broke through that $1520 support zone and gold has yet to ignite a new bull market move. We've had two very convincing bear market rallies but both have rolled over at that same $1400 level. I'm afraid this has probably so demoralized precious metal investors that when we get our next test of that sub $1200 level later this month there just aren't going to be any buyers left to defend that level. A third test of that support will almost certainly end in a break and final violent capitulation down to the next support zone at the 2008 high a little above $1000.
As gut wrenching as it is for me to say this, this final capitulation will probably shave another 30-50% off of the mining stocks and bankrupt many of the juniors.
There have been numerous warning signs over the last two weeks that the gold bear might not be done just yet. If we had seen a final bear market bottom on December 31 the miners should have rallied at least 75 to 100% in the first two months. Well two months went by and the best that the HUI could deliver was a 35% gain.
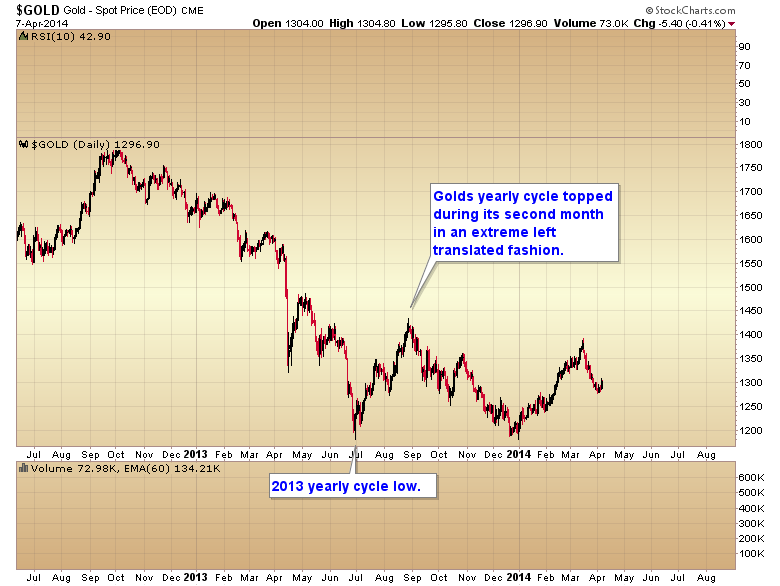
Also when gold failed to move above $1434 it set the yearly cycle up in an extreme left translated pattern. For those that don't know what translation is let me explain. Gold's yearly cycle for instance typically runs about 12 months from trough to trough. A cycle that tops in a right translated manner would find a high somewhere after the seventh month. A left translated cycle on the other hand would find a final top in six months or less. So if a cycle runs 12 months and tops in a left translated fashion on let's say month four it has eight months to decline. Much longer than the four months it rallied. So consequently, left translated cycles typically move below the previous cycle low. As you can see in the chart below gold's yearly cycle topped in an extreme left translated pattern on month #2.
As I have noted in previous reports gold is now moving down into an intermediate degree bottom, and this intermediate bottom will also be a larger degree yearly cycle bottom. The magnification of those two larger degree cycles coming together at the same time should create an exceptionally violent and aggressive move over the next 4-8 weeks. The risk is very high that gold is going to break that double bottom support over the next 1 to 2 months, and when it does I don't think anything will stop the decline until it reaches the next major support zone a little above $1000.
That's the point at which investors that have available cash will get the third great buying opportunity of this secular bull market. The first two delivered amazing gains as they came out of their bear market bottoms.
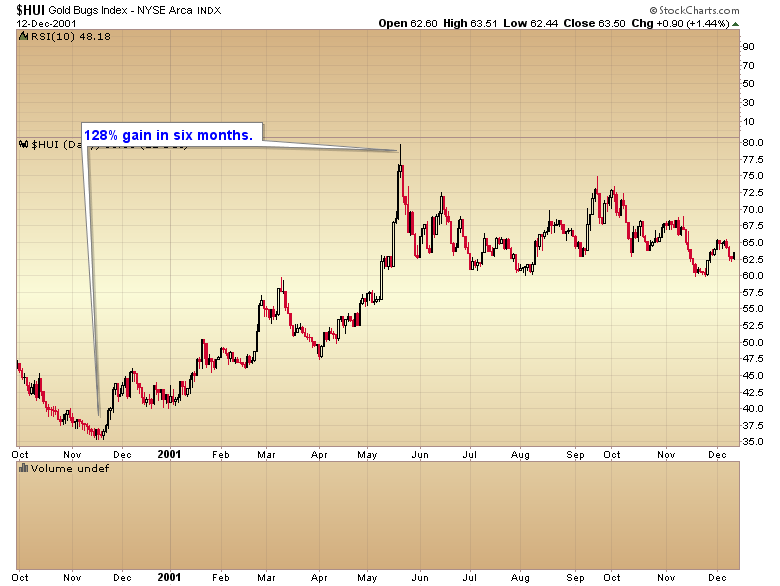
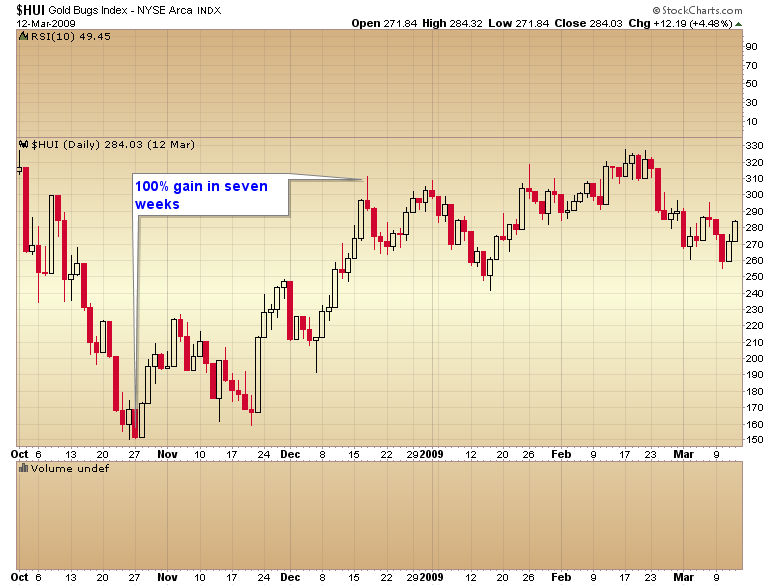
This coming bear market bottom will be no different, and it might be even more intense than the other two as it should kickoff the final 2-3 year bubble phase of the secular gold bull.
For those that have the mental fortitude to buy at the impending bottom when it looks like the entire sector is going to collapse forever, this is where millionaires and billionaires will be made.
Remember bear markets create opportunities and the bigger the bear, the bigger the opportunity. Just look at the recent bear market in stocks as an example. At the bottom in 2009 the stock market bear was the second most damaging in history. It generated a five year bull market that has rallied 185% and I don't think it's done yet.
Once the current counter trend rally is finished, and I don't really expect it to get through resistance at $1320-25, gold should head down into its final bear market bottom.
I look forward to trying to call that final bottom in real time over the next couple of months.
To sample the premium newsletter consider clicking on the subscription button at the top of the GoldScents home page and try a one week trial of the premium service that includes daily and weekend market updates.
Toby Connor
Gold Scents
GoldScents is a financial blog focused on the analysis of the stock market and the secular gold bull market. Subscriptions to the premium service includes a daily and weekend market update emailed to subscribers. If you would like to be added to the email list that receives notice of new posts to GoldScents, or have questions,email Toby.
© 2014 Copyright Toby Connor - All Rights Reserved
Disclaimer: The above is a matter of opinion provided for general information purposes only and is not intended as investment advice. Information and analysis above are derived from sources and utilising methods believed to be reliable, but we cannot accept responsibility for any losses you may incur as a result of this analysis. Individuals should consult with their personal financial advisors.
Toby Connor Archive |
© 2005-2022 http://www.MarketOracle.co.uk - The Market Oracle is a FREE Daily Financial Markets Analysis & Forecasting online publication.