Will Inflation Make A Comeback In 2014 When Consensus Worries About Deflation
Economics / Inflation Mar 26, 2014 - 10:42 AM GMTBy: GoldSilverWorlds
 Two months ago, Incrementum Liechtenstein released its chartbook entitled “Monetary Tectonics” which illustrated the raging war between inflation and deflation in 40 charts. Meantime, the authors of the chartbook have launched the “Austrian Economics Golden Opportunities Fund,” a fund that takes investment positions based on the level of inflation. The key tool in their investment decisions is the “Incrementum Inflation Signal” (also referred to as the “monetary seismograph”), a continuing measurement of how much monetary inflation reaches the real economy based on a series of market-based indicators.
The Incrementum Inflation Signal started showing rising inflationary momentum after a period of 19 month of disinflation. Is Inflation making a comeback just as the consensus worries about deflation risk? That was the subject of Incrementum’s first Advisory Board in which much respected names have a seat, including James Rickards, Heinz Blasnik, Rahim Taghizadegan, and Zac Bharucha. The Board was led by Ronald Stoeferle, managing director of Incrementum Liechtenstein, and its partner, Mark Valek. This article summarizes Incrementum’s Advisory Board meeting. The full transcript is at the bottom of this article.
The direction of inflation is important in Incrementum’s Inflation Signal, not the absolute figure. At the moment, especially central bankers and mainstream economists are scared of deflation. Further easing by central bankers could be expected going forward. Related to the Fed’s policy, Rickards expects a pause in the taper by July and perhaps increased asset purchases later this year. “They tapered into weakness. They should have not tapered in December by their own metrics, specifically inflation, employment and a few other things. I expect the sequence as follows: I think they will taper another $10 billion in April, pause in June and July, and then probably increase asset purchases later in the year (maybe August or September). That should be bullish for equities but also signal to commodity investors that inflation is on the way, because it just says that the Fed will do whatever it takes to get inflation.”
In particular the commodity complex shows a significant divergence: industrial metals (especially copper) are weak while agriculturals are very strong, just like precious metals and aggregate commodities. Heinz Blasnik points to China for a better understanding of the industrial metals weakness. “Broad money supply in China (M2) is now growing at 13.2%. That is at the low end from the range of the post decade. M1 has actually collapsed to 1.5% growth from almost 40% in 2009. I think that is where the weakness of industrial metals is coming from. It’s definitely China, because money supply growth is declining and also bank-lending and total lending are declining. It actually seems that house prices are beginning to turn down as well.”
The interesting thing about this breakup in commodities is that “nobody” is talking about it. This seems very reminiscent of the commodities rally that started in 2000-2002.
Related to these inflationary signals, the usefulness of the CPI as a decision making tool is highly questionable. Ronald Stoeferle compares today’s situation with the 70ies when Paul Volcker had the mandate to kill inflation, which is in contrast to today’s central planners who are desperate to create inflation. Their comfort zone is the official CPI inflation rate between 1.5% – 2.5%. They will do whatever it takes to create this inflation.
CPI statistics are not used in Incrementum’s Inflation Signal; the inflation data are market based indicators. The usefulness of the CPI is highly questionable because it cannot measure anything. Central bankers, however, care about it. They would be willing to keep an even higher CPI of 2%.
Rickards believes the CPI will continue to be used by the Fed until such time as nominal rates are normalized, although he thinks we are years away from a normalization of nominal rates. “In other words: If you actually got the Fed-funds-rate to 2.5% – 4%, they would not use quantitative easing as a tool; they would use the policy rate and they would like very much to get back to that world. The problem is that they cannot get back to that world. For so long as the policy rate is zero, they will use quantitative easing. But here is the problem: The global problem in the world today is that we are in a depression. You can have growth in a depression. When you have growth in a depression it is not a recovery. That’s the difference between a depression and a recession. The reason why this is an important distinction is that depressions are structural. When you have a structural problem you need structural solutions. You cannot solve it with monetary solutions because it is not a monetary problem.”
Incrementum’s Advisory Board sees a lot of strength in the current gold price action. In addition, Zac Bharucha points to the recent “independence” in gold. “It has been a sort of risk on, risk off trade. A lot of people have bought gold a couple of years ago because of an Armageddon scenario. And the Fed has postponed Armageddon for now. So a lot of gold got liquidated, and there was great temptation to pile into the rallying stock market. But now you are getting gold at a big discount from where it was selling 3 years ago.” Some people could be looking at gold’s $700 decline from its highs and consider it as a (cheap) insurance.
Stoeferle believes the strength in gold miners provides a confirmation for the metals. Just two months ago, the consensus was $1300 for the end of 2014, which was in significantly different from Stoeferle’s target of $1480. Interestingly, the reversal in gold basically started when the Fed started tapering. “My view is that perhaps, in the last couple of months, the price of gold was already discounting tapering, and perhaps now it is kind of discounting the tapering of taper. So perhaps the gold price is already telling us that there is something boiling.”
The problem for gold, however, is the opportunity cost with all kinds of other assets which are more a beneficiary of this inflationary politics. It could be the main reason of falling gold prices. It even looks like as if the inflationary politics had a deflationary effect on the economy by sucking a lot of funds into financial assets and out of the real economy.
Is the stock market topping? Is it in a bubble? Following indicators raise a yellow flag.
- The sentiment indicators in the US markets shows a very low cash in the mutual funds, just 3.3% cash, which is a historically very low level.
- Sentiment of advisors sits at the highest level since the 87 crash. So sentiment-wise the market looks very stretched.
- There is some of loss of participation in the stock markets but the breadth is still good in the US. Even if the market is turning, US leading stocks will still continue to outperform.
With the prospects of extremely low real interest rates in the foreseeable future, there are almost no profitable alternatives next to stocks, given the explosion in house prices and sky high bond prices. That is exactly what the Fed is aiming for. They want investors to go to long duration assets.
The advance since the 2009 low looks exactly like the bubble model from Sornette. The volatility declines more as the stock market goes higher. These are typical bubble characteristics.
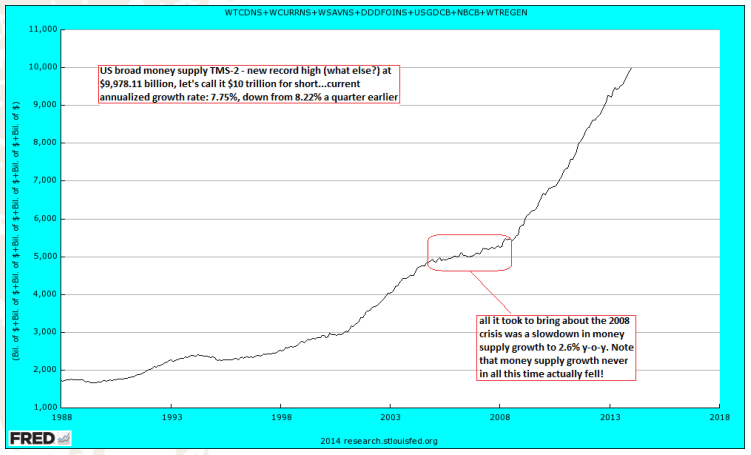
According to Heinz Blasnik, domestic US money supply growth is the decisive factor for US stocks. “The latest year-on-year growth is +7.75% which is below the 10% of 2012. So it is slowing down. But 7.75% year-on-year money supply growth is still quite a lot historically. So we have this strange situation where we have got a market which is overbought, and has extremely bullish sentiment readings. Still the market is going up and the only explanation that I can come up with is that money supply growth is still strong enough to push stocks higher. But there is a limit somewhere. The problem is that we don’t know where that limit is. In 2007, it was 2.6% year-on-year growth. That was enough to burst the real estate bubble and the stock market bubble at the same time. I believe that this time around this demarcation is going to be higher. The reason for believing so is because the underlying economy is much weaker. I would expect that, if money supply growth fall to say 4,5% year-on-year growth, it would be a very big warning sign.”

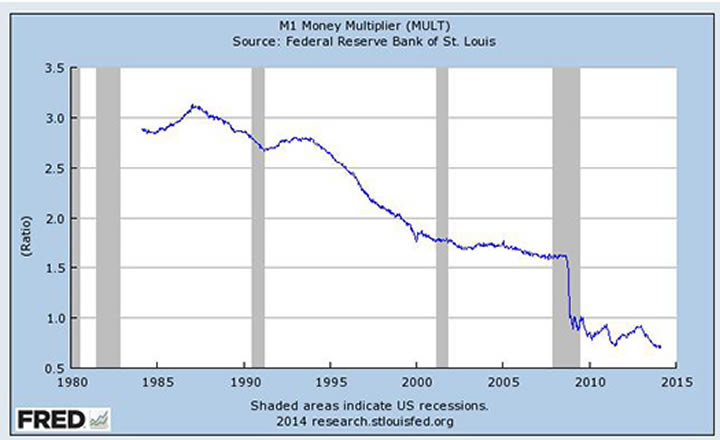
At the same time, velocity is going down as quickly as money supply is going up. So the question is not: “When does the money supply grow but rather when does velocity pick up?” When the velocity curve turns – that is the point when inflation comes in very rapidly. The problem is that this is a psychological threshold not a monetary threshold.

When velocity turns, it means nominal GDP is beginning to rise, and that probably means prices for other goods are starting to go up.
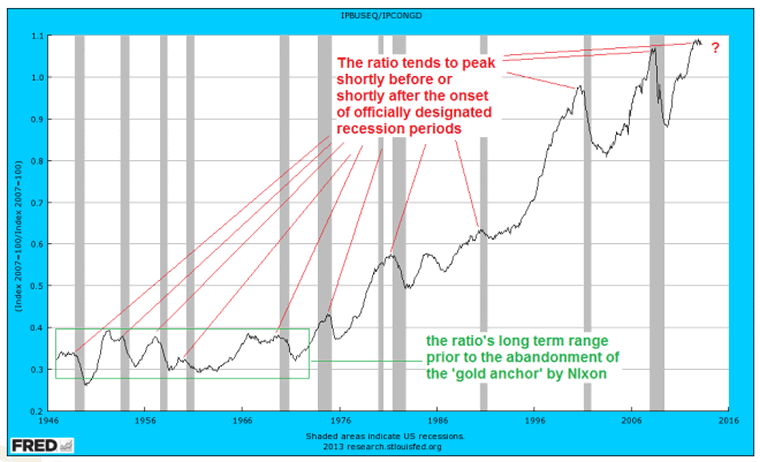
In addition, the following chart shows that when money supply is expanding and the central bankers are printing a lot of money and suppress interest rates, then money is flying to higher orders of production stages of the economy. It results in more investments in capital, and fewer investments in consumer goods production. Shortly before recessions begin, this process starts to turn over. Right now, it is kind of stalling out. Blasnik is not sure if that points to something meaningful, but if it were the case, it would tie in with the expectation that taper will produce later on this year much weaker economic numbers. This chart is supporting that contention (courtesy of www.acting-man.com)

In closing, there is an important point to be made about Crimea’s potential impact to the financial and monetary system. Rickards sees another nail in the coffin of the role of the US dollar as a reserve currency. One should consider the following. President Obama has more or less anointed Iran as the regional hegemon in the Middle East. This is a stab in the back to Saudi Arabia which for several decades has supported the dollar by insisting that oil has to be priced in dollars. The quid pro quo is that the US would in fact insure the national security of Saudi Arabia. By backing Iran, the US has undermined the national security of Saudi Arabia and therefore Saudi Arabia has less reason to support the dollar.
At the same time, the US is about to impose financial sanctions to Russia. The Russians have reacted by saying they would not pay their dollar loans, and begin to dump US Treasury bills.
We already know what China is doing with gold. Saudi Arabia has less reason to hold dollars because of Iran. Russia has less reason to support the dollar because of the Ukraine.
This is financial warfare on a scale never seen before. Putting all this together, a large part of the world is working very hard to get out of the dollar system. That is going to be bad for the dollar, and it is going to be good for gold.
© 2014 Copyright goldsilverworlds - All Rights Reserved Disclaimer: The above is a matter of opinion provided for general information purposes only and is not intended as investment advice. Information and analysis above are derived from sources and utilising methods believed to be reliable, but we cannot accept responsibility for any losses you may incur as a result of this analysis. Individuals should consult with their personal financial advisors.
© 2005-2022 http://www.MarketOracle.co.uk - The Market Oracle is a FREE Daily Financial Markets Analysis & Forecasting online publication.


