


Why Is The Federal Deficit Really Falling?
Interest-Rates / US Debt Mar 25, 2014 - 05:23 PM GMTBy: Dan_Amerman

 There are two ways a nation can use economic growth to reduce budget deficits. The first method is to participate in economic growth, with a growing economy increasing tax collections. A second method is to raise taxes so drastically that they consume all economic growth.
The United States government recently announced it has some great news - a fast moving economic recovery is slashing the size of the deficit.
“Thanks to the tenacity of the American people and the determination of the private sector we are moving in the right direction,” Treasury Secretary Jacob J. Lew said in the report. “The United States has recovered faster than any other advanced economy, and our deficit today is less than half of what it was when President Obama first took office.”
In this analysis, using numbers directly from the White House Office of Management and Budget, we'll take an independent look at these assertions and see if they are supported by the data.
1) We will examine whether the source of the shrinking deficit is indeed rebounding economic growth, or whether the actual source is higher federal government taxes taking a greater share of the economy.
2) We will look at how much economic growth is left for the private sector after adjusting for the substantially higher tax take from the federal government.
3) We will adjust economic growth for inflation, and examine the surprisingly powerful impact of inflation and rising taxes working in combination when it comes to reducing non-governmental economic growth.
4) We will examine whether this is an anomaly, or is instead the result of fundamental factors that are likely to persist in the future in the United States and in other nations in similar situations.
5) We will consider the implications if the true rate of inflation were to be even slightly higher than the official rate of inflation.
6) We will explore the broad range of implications for investors.
Economic Growth vs. Growth In Federal Taxation
According to official US government figures, the federal deficit, after being fairly stable at just under a $1.3 trillion annual deficit in fiscal years 2010 and 2011, fell to a level of approximately $1.1 trillion for fiscal year 2012, and then dropped all the way down to $679 billion for fiscal year 2013. This is getting close to a 50% reduction in the federal deficit in the two years between fiscal years 2011 and 2013.
During this time in nominal dollar terms (not adjusted for inflation) the reported gross domestic product (GDP) of the United States rose from approximately $14.8 trillion to approximately $16.6 trillion.
In those same years, federal tax receipts rose from a little under $2.2 trillion in fiscal year 2010 up to almost $2.8 trillion in fiscal year 2013.
Now just eyeballing those two figures, it would appear that the federal tax receipts are jumping up faster on a percentage basis than the growth in the economy. Is that indeed the case, and how great is the differential?
(click here to see the supporting calculations)
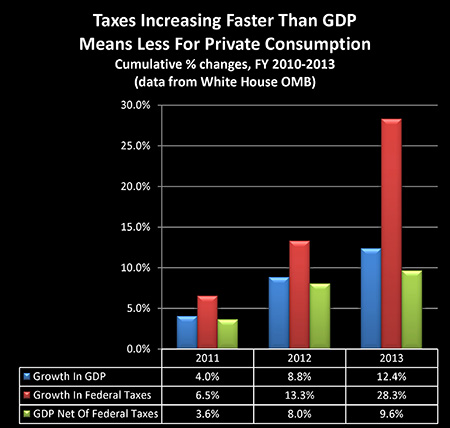
As shown in the blue bars in the graph as well as the percentages in the table, the United States economy grew 4% between 2010 and 2011, it cumulatively grew 8.8% by 2012, and grew a total of 12.4% by 2013.
Now what is fascinating is when we look at the red bars, which are the cumulative percentage growth in federal tax receipts.
Per the government's figures, the economy grew by 4% in 2011 – but federal taxes grew by 6.5%.
In over two years between 2010 and 2012, the economy grew by 8.8% – but federal taxes grew by 13.3%.
And most remarkably, taking into account the sharp increase in taxes that took place at the end of the 2012 calendar year, while the US economy cumulatively grew by 12.4% between 2010 and 2013 – federal tax receipts grew by 28.3%.
The graph – and the underlying numbers – are unmistakable.
Federal tax receipts are growing at a much faster rate than the economy itself.
So to understand exactly why it is that the deficit has been falling so sharply – it is because the government is taking significantly more of the economy than it previously was.
Determining Growth Not Consumed By Taxes
Another approach is to look at how much economic growth is left for the private sector once we adjust for increasing federal tax revenues. While a somewhat unconventional measure, this could also be called one of the most crucial measures of all. Because obviously, the more the federal government takes, the less that is available for everyone else.
And if federal tax receipts are rising at rate that is greater than overall economic growth, then the share of the economy available for the private sector must necessarily be growing at a rate that's less than the overall rate of economic growth.
So if we look at the first year between 2010 and 2011, if gross economic growth was 4% (the blue bar), but the federal government's take from the economy rose by 6.5% (the red bar), that means that only 3.6% in growth (the green bar) was available for the rest of us.
Where things become dramatic is when we look at our three years of cumulative growth between 2010 and 2013.
The economy grew by 12.4%, but federal tax receipts jumped up by 28.3%, leaving only 9.6% available for the rest of the country.
How Inflation Changes The Picture
Now an issue with looking only at gross economic growth is that it does not take into account the destruction of a currency's purchasing power. That is, if we just look at GDP, we're not necessarily looking at economic growth, but may actually just be looking at the effects of inflation.
So what is routinely done is to adjust GDP for inflation through the use of a GDP price deflator. And when we do so here, we find that much of our economic growth disappears.
(click here to see the supporting calculations)
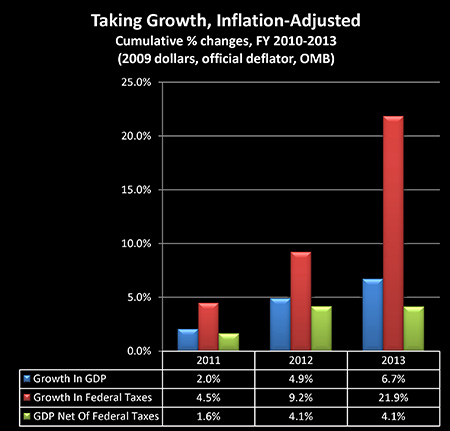
Adjusted for inflation, GDP is now up only 2% through 2011, 4.9% through 2012, and 6.7% through 2013.
For the next step, in order to keep an exact "apples to apples" comparison, we took the same GDP price deflator and applied it to federal tax receipts. This ensures that federal taxes get exactly the same inflation adjustments as what is being applied to gross domestic product.
Adjusting for inflation, we find that federal tax revenues grew by 4.5% in the first year, by 9.2% over two years, and by 21.9% over three years.
So we see a far more dramatic difference between the growth in the economy and the growth in taxes. We go from government tax rates increasing at a rate of a little more than twice the growth of GDP in nominal terms (28.3% to 12.4%), to inflation-adjusted taxes growing at more than three times the rate of inflation-adjusted growth in GDP (21.9% to 6.7%).
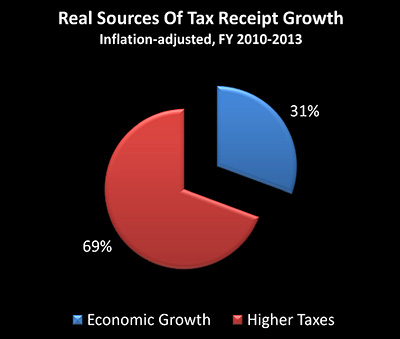
The real economy (if we accept official US government inflation rates) grew by only 6.7% over three years, while the federal government's real take of that economy rose by a remarkable 21.9%. Because 6.7% in economic growth is only equal to 31% of the total 21.9% increase in tax revenues, this means that economic growth only accounted for 31% of real tax growth, while it was the increase in tax rates that generated the other 69%.
So while the reduction in deficit is being presented as increased revenues from a surging economy, in fact more than 2/3 of the growth in tax receipts was simply from raising taxes.
Real Private Sector Growth
The next crucial step involves looking at inflation-adjusted GDP and subtracting inflation-adjusted federal taxes, which together determine the real bottom line of what is available for the rest of us.
Net of the increase in federal taxes, real economic growth was 1.6% in 2011, it was 4.1% cumulatively over two years in 2012, and – this is where things get really interesting – our after-federal tax and after-inflation GDP stayed at 4.1% during fiscal year 2013, the very year of the drastic reduction in the deficit.
After federal taxes the real economy cumulatively grew by 4.1% in the two years through 2012, but total growth was still only a cumulative 4.1% in the three years through 2013. That is because all growth in real GDP in 2013 was consumed by higher federal taxes alone. (Including increases in state and local tax collections would just reduce what is available for the private sector that much more.)
So to place a little more accuracy on the press releases, it wasn't a surging economy that reduced the deficit from $1.1 trillion in 2012 to $659 billion in 2013. Instead it was the federal government taking 100% of real economic growth for the nation that so dramatically reduced the deficit in 2013. And because this redistribution of the economy from the private side to the federal government is the result of tax code changes, it is not a one-time occurrence, but will continue to persist with each passing year.
The "Crowding Out" Of Private Economic Growth
In the 2nd half of this article:
4) We will examine whether this is an anomaly, or is instead the result of fundamental factors that are likely to persist in the future in the United States and in other nations in similar situations.
5) We will consider the implications if the true rate of inflation were to be even slightly higher than the official rate of inflation.
6) We will explore the broad range of implications for investors.
Daniel R. Amerman, CFA
Website: http://danielamerman.com/
E-mail: mail@the-great-retirement-experiment.com
Daniel R. Amerman, Chartered Financial Analyst with MBA and BSBA degrees in finance, is a former investment banker who developed sophisticated new financial products for institutional investors (in the 1980s), and was the author of McGraw-Hill's lead reference book on mortgage derivatives in the mid-1990s. An outspoken critic of the conventional wisdom about long-term investing and retirement planning, Mr. Amerman has spent more than a decade creating a radically different set of individual investor solutions designed to prosper in an environment of economic turmoil, broken government promises, repressive government taxation and collapsing conventional retirement portfolios
© 2014 Copyright Dan Amerman - All Rights Reserved
Disclaimer: This article contains the ideas and opinions of the author. It is a conceptual exploration of financial and general economic principles. As with any financial discussion of the future, there cannot be any absolute certainty. What this article does not contain is specific investment, legal, tax or any other form of professional advice. If specific advice is needed, it should be sought from an appropriate professional. Any liability, responsibility or warranty for the results of the application of principles contained in the article, website, readings, videos, DVDs, books and related materials, either directly or indirectly, are expressly disclaimed by the author.
© 2005-2022 http://www.MarketOracle.co.uk - The Market Oracle is a FREE Daily Financial Markets Analysis & Forecasting online publication.