


The Run On U.S. Gold Continues....
Commodities / Gold and Silver 2014 Mar 24, 2014 - 03:26 PM GMTBy: Steve_St_Angelo

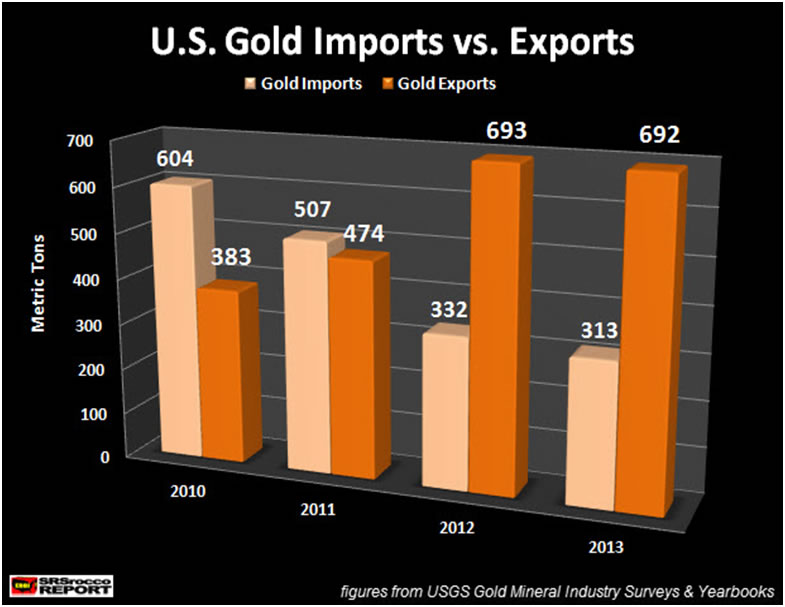
 So where is China getting all of its gold? One of the large sources turns out to be the United States. The U.S. experienced another record year of net gold exports in 2013. Not only were gold exports at record levels, imports into the U.S. fell nearly half compared to 2010.
If we look at the chart below, U.S. gold exports in 2010 were 383 metric tons (mt), however by 2013, they increased 81% to 692 mt. In addition, U.S. gold imports fell 48% from 604 mt in 2010 to 313 mt in 2013.
According to the USGS Gold Mineral Industry Survey (published late), the U.S. exported the majority of its gold in the first half of the year. By the end of June, the U.S. exported 406 mt, averaging 68 mt a month. In the second half of the year, the U.S. only exported 286 mt, averaging 48 mt a month.
The months with the largest exports during 2013 were March at 89.1 mt and April at 76.6 mt. The total import-export figures based on three categories of gold:
1) ores & concentrates
2) Dore' & precipitates
3) Refined bullion
The overwhelming majority of gold exported was in the form of Refined bullion (488 mt), followed by Dore' bars & precipitates (197 mt) and ores & concentrates (7.6 mt). If we just focus on refined gold bullion exports, the table below details which countries received gold from the U.S. in 2013:
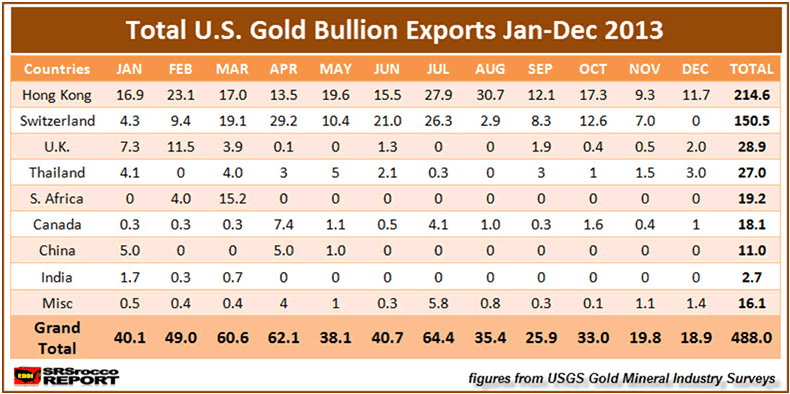
As we can see, Hong Kong received the most gold bullion from the U.S. at a total of 214 mt, followed by Switzerland at 150 mt and the U.K. at nearly 29 mt. Thus, the top three countries imported 393 mt (80%) of the total 488 mt exported in 2013.
Some interesting data points to look at are the 27 mt imported by Thailand and 11 mt China received in 2013. If the majority of U.S. gold exported to Hong Kong and Switzerland made its way to China and other Eastern countries, we can assume that nearly 75% of total U.S. gold exports went to the East... with the majority going to the Chinese.
The huge wholesale buying of gold by the Chinese in 2013, put a big damper on U.S. gold imports. Koos Jansen at InGoldWeTrust stated that total Chinese wholesale gold demand was 2197 mt in 2013. According to Koos, this did not include Peoples Bank of China purchases which may have put the total at 2,500 mt.
As the U.S. struggles to maintain its domestic gold production, mine supply fell from 234 mt in 2012 to 231 mt in 2013. This may not seem like much of a decline, but if we look at a longer dated chart.... the U.S. peaked in gold production in 1998 at 366 mt.
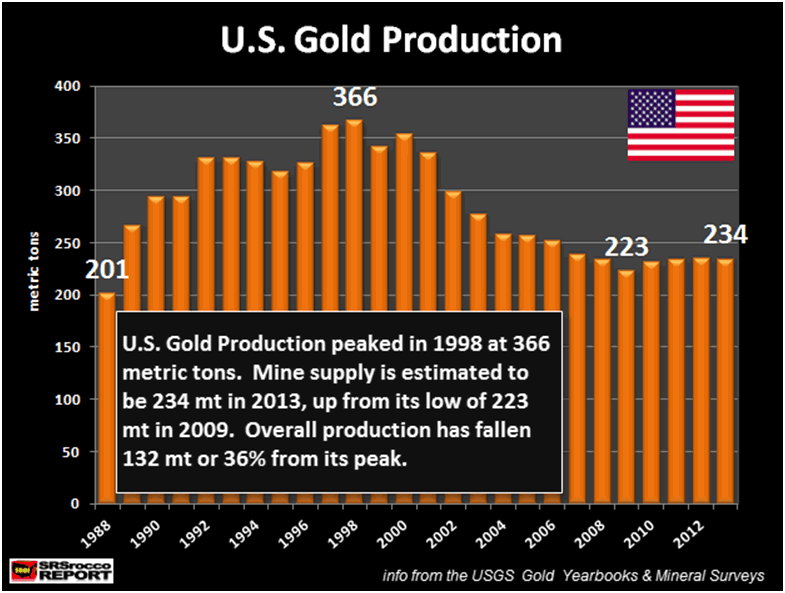
This chart published in my article, GOLD PRODUCTION WARS: The East Slays The West, shows that U.S. gold production declined 36% since 1998. The USGS estimated domestic production would remain flat in 2013 at 234 mt, however it fell slightly. If you haven't read the article linked above, I highly recommend it.
Since 1997, the year the top three Western gold producers peaked, total gold production from Australia, U.S. and Canada declined from 845 mt to an estimated 624 mt in 2013. On the other hand, the two top Eastern producers (China & Russia) increased their produce in the same time period from 290 mt to a staggering 664 mt in 2013.
This is clearly seen in the table below:
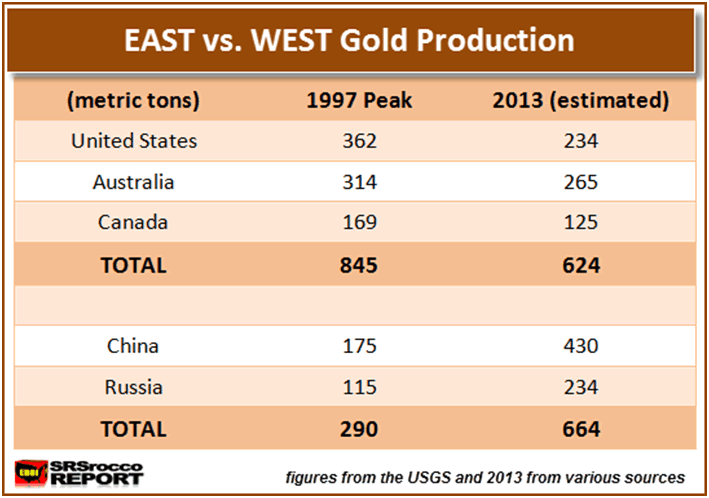
Amazingly, China & Russia's gold production now surpasses the total of the top three Western countries by an estimated 40 metric tons. Things just don't look good for the West.
As the West continues to print fiat currency and manufacture derivatives to keep their financial systems from imploding, the Chinese and Russians focus on increasing their domestic gold mine supply while the East absorbs whatever gold the West can deliver.
This becomes even more apparent when we look at the following chart. Even though total U.S. gold exports in 2013 were nearly the same as they were in 2012, net gold exports increased due to a drop in imports and a decline mine supply.
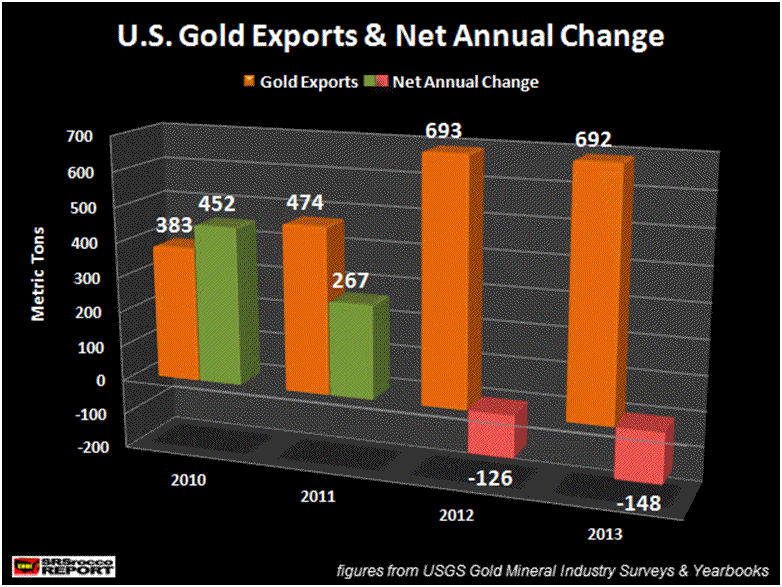
(figures above based on imports, exports and domestic mine supply)
Here we can see the United States had net gold imports of 452 mt in 2010 and 267 mt in 2011. However, in the past two years net gold imports turned negative. In 2012, the U.S. suffered a negative gold net import of 126 mt and increased this amount to a net loss of 148 mt in 2013.
In the past two years, the United States exported 275 metric tons of gold more than its total domestic mine supply and imports combined. This is not a trend that can last very long or the U.S. will find its gold shelves empty at some point in the future.
I plan to publish an interesting article on the huge decline of U.S. Gold scrap exports. There were some very interesting events that took place in the U.S. gold scrap import-export market in 2013.
Please check back at the SRSrocco Report as I will be providing a new REPORTS PAGE including my first paid report, THE U.S. & GLOBAL COLLAPSE REPORT. You can also follow us at Twitter at the link below:
© 2005-2022 http://www.MarketOracle.co.uk - The Market Oracle is a FREE Daily Financial Markets Analysis & Forecasting online publication.