


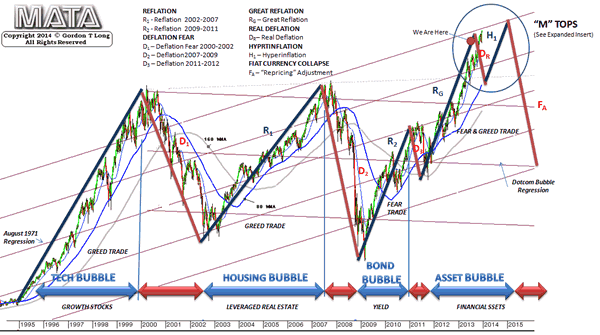
Fed Still Pumping, But FDI Goes Negative? Stock Market M Tops
Stock-Markets / Financial Markets 2014 Feb 25, 2014 - 12:39 PM GMTBy: Gordon_T_Long

 Bear Stearn, Lehman Level Foreign Flows
If you are traveling at 100 mph and you abruptly hit the car breaks, as a passenger it can cause serious consequences. If the car is then suddenly slammed into a reverse direction, a fatality may often the likely outcome. Similarly, with FDI (Foreign Direct Invest) not only dramatically slowing but also being slammed into a negative direction, we might expect major consequences! However, true to form our Keynesian government economist and the compliant media report this by saying it is a short term anomaly. Tell this to the passengers!
Dramatically Slowing US Foreign Flows
"Houston, We Have a Problem!"
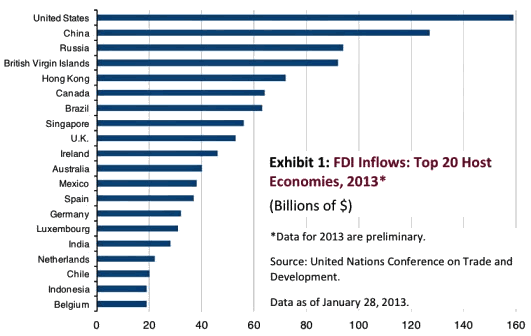
It is likely not a surprise to learn that the U.S. is the top destination for foreign direct investment (FDI). According to new United Nations data cited by U.S. Trust's Joseph Quinlan, the U.S. accounted for $159 billion of inflows of the global total of $1.46 trillion of flows in 2013. However, what is little reported is this is down from $168 billion in 2012.
- 2012 $168B
- 2013 $159B
-$1.46B THIS MUST GROW NOT GO NEGATIVE - IT IS NOT ABOUT THE ABSOLUTE AMOUNT BUT RATHER THE RATE OF CHANGE AND WHETHER IT IS POSITIVE OR NEGATIVE IN THE ABSOLUTE
This came as the U.S. economy accelerated through the year?
The chart below shows the most recent holdings from the TICS report of Chinese Treasurys in a nutshell:
Chinese Treasury holdings plunged by the most in two years, after China offloaded some $48 billion in paper, bringing its total to only $1268.9 billion, down from $1316.7 billion, and back to a level last seen in March 2013!
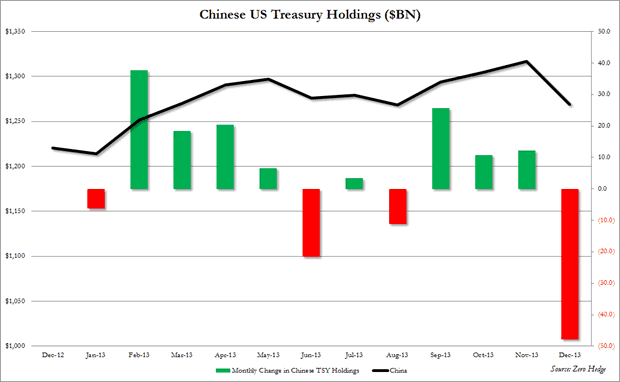
This was the second largest dump by China in history with the sole exception of December 2011.
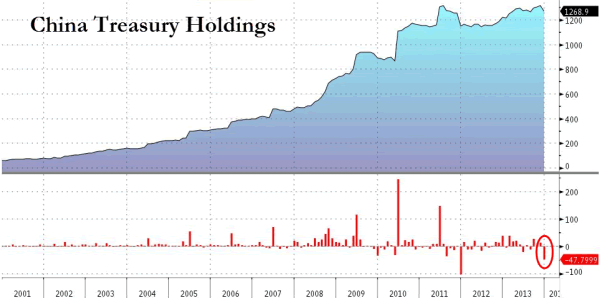
That this happened at a time when Chinese FX reserves soared to all time highs and not investing in US paper should be quite troubling to anyone who follows the nuanced game theory between the US and its largest external creditor, and the signals China sends to the world when it comes to its confidence in the US.
Yet what was truly surprising is that despite the plunge in Chinese holdings, and
Japanese holdings also dropped by $4 billion in December,
... is that total foreign holdings of US Treasuries increased in December, from $5716.9 billion to 5794.9 billion.
Why? Because of this country -- Belgium (i.e. the EU)
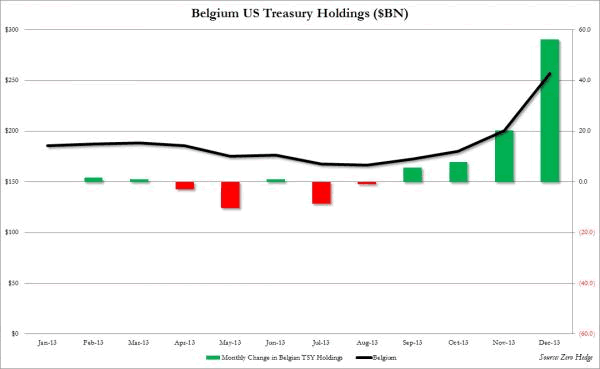
At a time when America's two largest foreign creditors, China and Japan, went on a buyers strike, the entity that came to the US rescue was Belgium, which as most know is simply another name for... Europe: the continent that has just a modest amount of its own excess debt to worry about.
One wonders what favors were (and are) being exchanged behind the scenes in order to preserve the semblance that "all is well"?
GLOBALIZATION TRAP - Foreign Purchases Suggest Slowing Global Economies with less Easy Credit to Invest
China sold the second biggest amount of US Treasuries in December. However, total foreign bond holdings actually rose in the last month of 2013 and as the chart below confirm when it comes to Long-Term Treasury paper; foreigners were actually buyers of some $18 billion in Treasuries.
It is everything else that they sold in the month when the S&P hit its all time high: specifically, foreigners were net sellers of
- Agency securities ($15.4 billion),
- Corporate Bonds ($7.5 billion) and
- Corporate Equities ($13.7 billion)
.. something which hardly fits with the narrative of the record stock market high generating confidence in even more buying down the line.
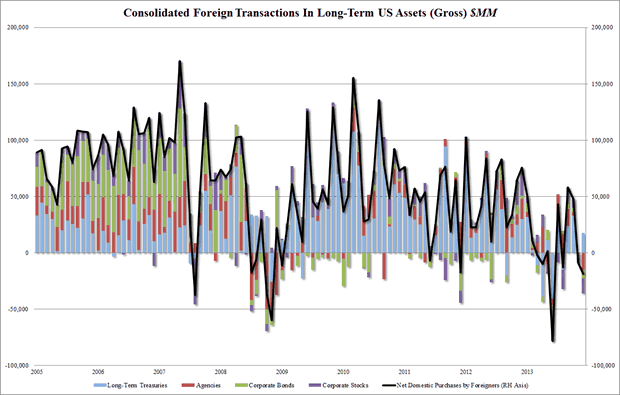
In the chart above it is the black line - gross purchases of US long-term securities - that is the most troubling, as its trend is hardly anyone's friend.
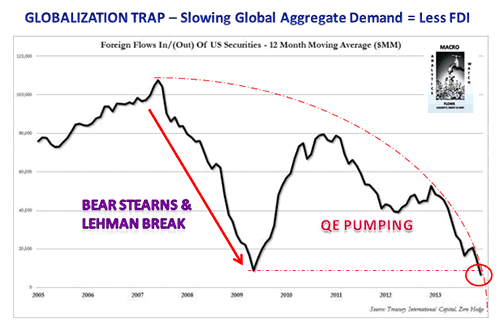
So what happens when one smooth's out the line to normalize for monthly fluctuations? This:
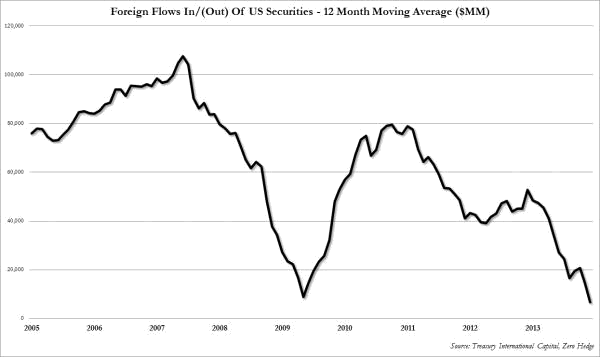
The chart is very disturbing: it shows that as the S&P rises higher and higher (on ever declining volumes), foreigners are buying fewer and fewer US securities.
In fact, on a 12 Month Moving Average basis, foreigners bought less long-term US securities than they did when Lehman crashed!
Luckily we live in a New Normal when price is no longer determined by simple supply and demand (and certainly not from retail investors who have long since given up on the fraudulent, broken US capital "markets") but Fed jawboning of
- A record $2.5 trillion in bank excess reserves,
- Corporate buybacks and
- HFT algos spurring momentum ignition and buying because others are buying.
And so we have come full circle, because while, understandably, nobody had any appetite for US securities around the Lehman crash until the Fed stepped in and singlehandedly took over the US capital markets it was unclear if there even would be a US capital markets. Now five years later the S&P has risen to a level nearly three times the March 2009 lows thanks entirely to the Fed's $4.1 trillion balance sheet backstop, the interest in US securities is... lower than it was in the days just after Lehman.
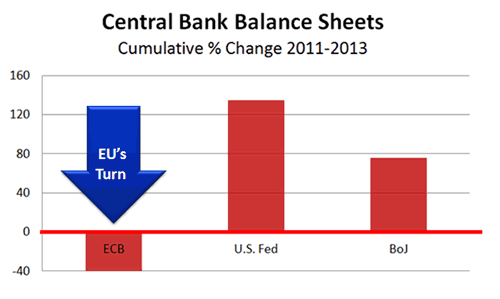
Expect The ECB To Implement an EU Form of QE
In the short term there is only one easy way out and politicians always take the easiest most expedient way.
The answer is for the EU through the ECB to 'stand to the plate' and take their turn at central bank money pumping. They have been the positive recipients over the last few years and now it is their turn.
The just concluded G-20 Summit Conference in Sydney, Australia produced a document saying that another $2 Trillion needed to be added to the Global Economy, but blatantly avoided saying how this would happen.
Mario Draghi however was front and center in a staged press conference saying that the March 7th ECB meeting was pivotal on what the ECB's plans would be going forward. Based on the German Bundesbank recently capitulating on the requirement for the ECB to "sterilize" monetary operations, it appears Draghi with the G-20 breathing down his neck has a green light to step up to the plate.
None of this should be a surprise. It is all playing out in a fully choreographed almost preordained play.
A Play With a Pathway To a Globalization Trap
All of this has placed the world on a destructive path towards what can best be termed a "Globalization Trap" and eventually a Global Fiat Currency Crisis. The road map is easy to discern and quite evident if you actually study the sign posts without wearing Keynesian filtering glasses and apply a dose of common sense.
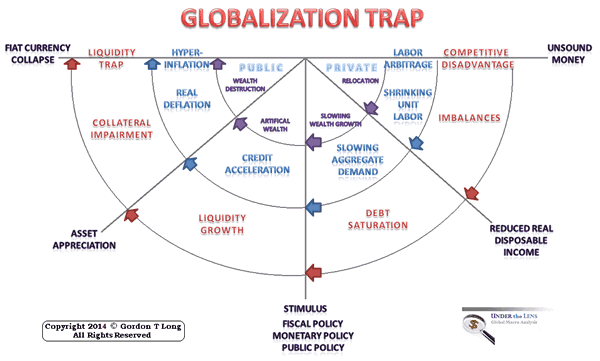
Profound Implications To Global Financial markets
The road map has profound implications for the financial markets as economies of both the Developed and Emerging Economies likely continue to rotate through the cycle shown and labeled in the chart below.
For more detail signup for your FREE copy of the GordonTLong 2014 THESIS PAPER
Signup for notification of the next MACRO INSIGHTS
Request your FREE TWO MONTH TRIAL subscription of the Market Analytics and Technical Analysis (MATA) Report. No Obligations. No Credit Card.
Gordon T Long Publisher & Editor general@GordonTLong.com
Gordon T Long is not a registered advisor and does not give investment advice. His comments are an expression of opinion only and should not be construed in any manner whatsoever as recommendations to buy or sell a stock, option, future, bond, commodity or any other financial instrument at any time. While he believes his statements to be true, they always depend on the reliability of his own credible sources. Of course, he recommends that you consult with a qualified investment advisor, one licensed by appropriate regulatory agencies in your legal jurisdiction, before making any investment decisions, and barring that you are encouraged to confirm the facts on your own before making important investment commitments. © Copyright 2013 Gordon T Long. The information herein was obtained from sources which Mr. Long believes reliable, but he does not guarantee its accuracy. None of the information, advertisements, website links, or any opinions expressed constitutes a solicitation of the purchase or sale of any securities or commodities. Please note that Mr. Long may already have invested or may from time to time invest in securities that are recommended or otherwise covered on this website. Mr. Long does not intend to disclose the extent of any current holdings or future transactions with respect to any particular security. You should consider this possibility before investing in any security based upon statements and information contained in any report, post, comment or suggestions you receive from him.
Gordon T Long Archive |
© 2005-2022 http://www.MarketOracle.co.uk - The Market Oracle is a FREE Daily Financial Markets Analysis & Forecasting online publication.