Reviving the ‘Real World’ Scenario That’s Disappeared from Government Reports
Economics / Economic Statistics Feb 25, 2014 - 10:15 AM GMTBy: Submissions
 F. Wiley writes: For 50 years or so the federal government has deliberately and to an increasing extent misstated probable future budget deficits. Democrats and Republicans are guilty. The White House is guilty. And so is Congress. Private firms that deliberately misrepresent their financial statements in this fashion would be guilty of a crime… The magnitude of the misrepresentation is breathtaking. - Former St. Louis Federal Reserve Bank President William Poole, writing in the Wall Street Journal last April
In the op-ed excerpted above, William Poole harshly criticizes government budget projections, including those published
by the Congressional Budget Office.
We’re guessing he was especially miffed with the annual budget outlook released by the CBO on February 5th.
Consider that Poole favored the “alternative scenario” that can sometimes be found deep within CBO reports and spreadsheets. This scenario corrects for at least a few of the absurd assumptions in the primary budget projections (the “baseline scenario”) that receive 99% of the media’s attention. Poole called the alternative scenario “the only truly honest and useful effort in town.”
Alas, the alternative scenario is no more – the CBO removed it from their annual outlook. Taxpayers can no longer find meaningful budget projections anywhere in the CBO’s work.
Let’s see if we can fill in the gap.
We’ll start with the baseline from this month’s report:
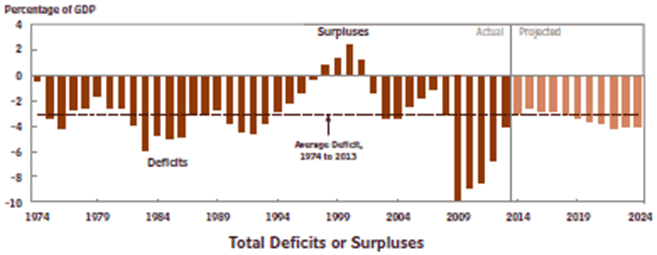
The chart shows a shrinking deficit over the next couple of years, but don’t get too excited. Apart from other issues we’ll discuss, this is explained by a long-standing prediction for a robust economic recovery, which hasn’t yet come to pass. It’s not so much a budget outlook as a hopeful forecast.
After the supposed economic boom levels off in 2018/19 (according to the assumptions), the figures no longer hide our deteriorating finances. But the deterioration is likely to be much worse than the chart suggests, as we’ll explain below. To create a more realistic outlook, we’ll adjust the baseline scenario for four different types of deficiencies in the CBO’s approach:
Step #1: We deal with dishonest lawmakers
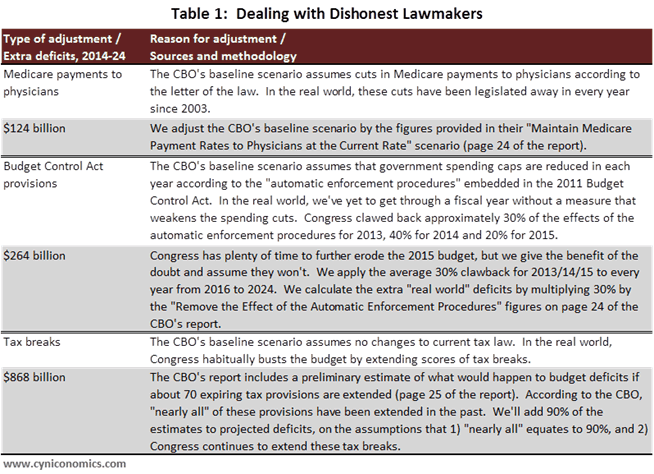
One of the challenges in budget forecasting is that tax and spending laws are full of provisions that are all but guaranteed to be reversed before they take effect. These dead-on-arrival provisions only exist to create the appearance of fiscal rectitude. And the deception works because the CBO is required by governing statutes to build the phony provisions into its baseline, which the media then endorses as an authoritative view of public finances.
Fortunately, though, the CBO’s new report provides data we can use to neutralize some of the lawmakers’ tricks, as explained in Table 1 below:
Step #2: We get real with the economy
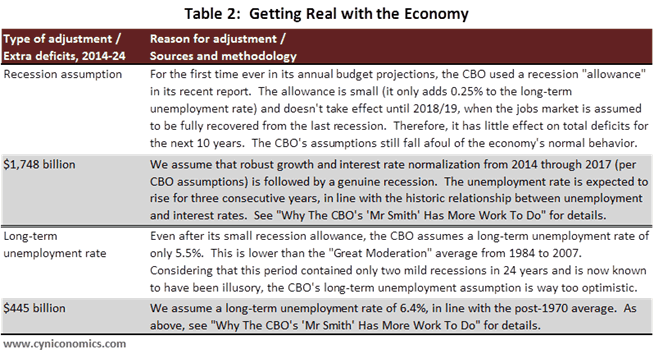
The good news in the CBO’s latest report is that they made a few needed changes to the underlying economic assumptions. The bad news is that they have much more to do – the economic outlook remains unrealistic.
Once again, though, we can use data in the report (Appendix E, in this case) to improve the projections. We explained our adjustments in detail in “Why The CBO’s ‘Mr. Smith’ Has More Work To Do,” and they’re summarized in Table 2 below.
Note that we’ve accepted the CBO’s strongly optimistic outlook for the next four years, not because we like it but because it’s easier to show inconsistencies and come up with a more realistic scenario in later years (after the assumed recovery reaches historic extremes).
Step #3: We put on our actuarial hats
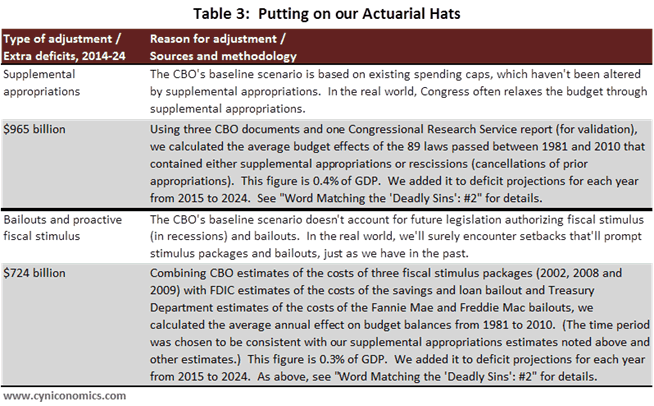
It doesn’t take much business experience to know that budget plans are regularly thrown off track by unexpected events, and the federal budget is no different. In fact, the CBO always acknowledges the risks of such setbacks. Yet, its governing statutes don’t permit accounting for most types of unexpected events in the baseline scenario.
In any case, the CBO doesn’t provide sensitivity analysis estimating their possible effects. Here’s what we had to say about this in an earlier post:
[M]any events are deemed too unpredictable to be estimated – an excuse that defies both collective knowledge and common practice. Actuaries, accountants and financial risk managers are all trained to place numeric estimates on unforeseen risks. Insurance premiums, credit loss provisions and investment decisions are all based on these numeric estimates.
The key is that any positive number is better than nothing. We can see the problem with nothing just by noticing that the debt debate almost never gets around to the risks of recessions, financial crises, wars, natural disasters, and so on. Political leaders and pundits habitually ignore the CBO’s warnings that these events will occur from time to time, relying instead on its incomplete projections.
In the same post, we explained our approach to adjusting budget projections for unforeseen events. One of our recommendations, which accounts for the effects of automatic stabilizers and doesn’t violate the CBO’s statutes, was implemented by the CBO for the first time in this month’s report. The other adjustments are summarized in Table 3 below:
Step #4: We recognize that debt owed to trust funds is, indeed, debt
The question of whether to look at gross debt (including obligations to trust funds such as the Social Security and Medicare hospital insurance funds) or net debt (excluding those obligations and other intra-governmental holdings) is a tired subject. It’s probably fair to say that net debt advocates don’t care much about debt to begin with, while those who point to gross debt do care. We offered our two cents here. Among other points, we described the paradox that fiscally profligate governments can lower net debt (but not gross debt) by merely expanding certain types of entitlement programs, even if the expansions are fiscally unsustainable. In fact, America’s current financial position shows that this is exactly what we’ve done. For this reason and others, trust fund debt should be added back to the net figures highlighted by the CBO.
Putting it all together
Note that the figures in the tables above exclude debt service costs. After breaking the baseline into components and making our adjustments, we then create new projections that include recalculation of debt service.
The Steps 1 and 3 adjustments are combined into a projection that we call “Congress does what it usually does,” while the Step 2 adjustment is blended into our “and the economy does what it usually does” projection. The Step 4 adjustment is shown in the “and trust fund debt counts” projection in the final chart.
Here are our results, for deficits first and then debt:
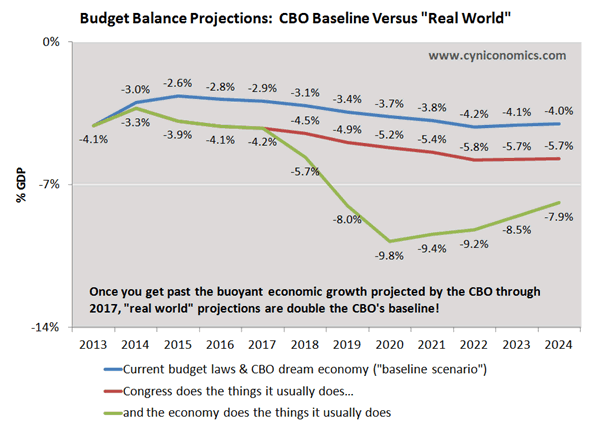
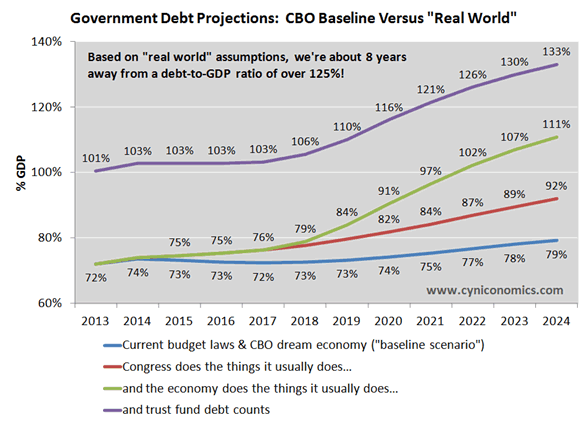
While the charts speak for themselves, we’ll turn again to Poole’s op-ed to sum up America’s finances:
U.S. fiscal policy is in a chaotic state. Policy decisions are wrapped around the convoluted budget accounting that Congress and the White House use to obfuscate, dissemble and hide what is really being done. That is a tragedy, and our democracy is worse for it.
Indeed.
(Click here for an appendix to this post containing the year-by-year added deficits for each of our adjustments, in dollars.)
F.F. Wiley
F.F. Wiley is a professional name for an experienced asset manager whose work has been included in the CFA program and featured in academic journals and other industry publications. He has advised and managed money for large institutions, sovereigns, wealthy individuals and financial advisors.
© 2014 Copyright F.F. Wiley - All Rights Reserved
Disclaimer: The above is a matter of opinion provided for general information purposes only and is not intended as investment advice. Information and analysis above are derived from sources and utilising methods believed to be reliable, but we cannot accept responsibility for any losses you may incur as a result of this analysis. Individuals should consult with their personal financial advisors.
© 2005-2022 http://www.MarketOracle.co.uk - The Market Oracle is a FREE Daily Financial Markets Analysis & Forecasting online publication.


