


All Eyes On Gold And China When Silver Could Be The Tipping Point
Commodities / Gold and Silver 2014 Feb 22, 2014 - 09:50 PM GMTBy: Michael_Noonan

 incense - [noun] an aromatic substance acquired from certain resinous trees with aromatic biotic materials which release fragrant smoke when burned. The odor produced from smoke is not the incense, but the substance that is burned.
Fundamentals for gold and silver have become the incense of reality for Westerners. The primary focus is on how many tonnes of gold China has been importing for the past many years, the depletion of available stocks from the central bankers straw men, aka the LMBA and COMEX, the number of coins sold by various governments to the public, [a relative drop in the bucket, but its reporting has a sensation factor], etc, etc.
We address this via charts as the best source for market pricing information, particularly citing an example in silver. As a note to anyone not overly familiar with charts, or even turned off by them for lack of understanding or appreciation, we can tell you that the markets are full of logic, and we use charts as a reference to explain how any market will develop in a logical way, [never random for those who mistakenly believe markets are such], and how that logic can be put to profitable use.
All of the collective fundamental factors are important, and they are the underpinning for the future performance of the PMs, [Precious Metals]. They are the substance, but the smoke they are producing is clouding the sense part of the incense. Westerners see all the smoke and expect a hand-to-eye coordinated effect in the markets, in the form of higher prices, and therein lies the rub.
For Westerners, and truest of Americans, gold is all about its price. Price, price, price. "What is the price of gold, today?" "Where is today's price relative to the highs of a few years ago?" Then there is the ultimate question, "When are gold and silver going to take off?"
Gold, in particular, does not have the same sense of importance for Westerners as it does for Easterners, mainly China, India, Turkey, parts of the Middle East. The elites, born from the Rothschild dynasty, through their central banks have manipulated not only the price of gold, but also the minds of the masses as they [do not] realte to gold.
Once the moneychangers, [we use various names, but they all reflect back to the always clandestine Rothschild-created group that has been in control of the Western world money supply, and by extension, Western governments], once these moneychangers bankrupted and gained control of the United States, they directed the American proxy-puppetmeister, Franklin Delano Roosevelt, to shut down the banking system and reopen it under total control of the elites.
What came next? The deceitful scheme of confiscating gold from Americans, addressed in previous Commentaries, [See NWO "Problem-Reaction" Ploy, paragraphs 1 - 4, and 13 - 15, as a recent example]. Consequently, the central bankers removed gold from the public both physically and psychologically. Most Americans alive today have never even held or touched a gold coin, so it has no value as a money-related substance. "Mission Accomplished" for the elites in ridding its only competition to its paper fiat Ponzi scheme.
For Easterners, gold has always been a part of their lives, and they respect PMs as a store of value when all else fails. The price of gold for Easterners? It does not matter. Owning it is all that counts, and they keep buying and holding gold irrespective of price. Families are known to keep it for generations.
The point to be made is Western focus is on the smoke produced by the incense, and that, in turn, affects the common sense in recognizing the importance of owning, holding, and the ongoing acquisition of PMs, not because of its price, but for its historical relevance as the most effective antidote to fiat currencies, every one of which has totally failed.
The foreign-owned Federal Reserve central bank issues fiat Federal Reserve Notes, [FRN], which the Fed deceitfully calls "dollars. FRN are commercial debt instruments, in law. If you know nothing else about money, know this: debt can never be money, yet Americans, indeed the world, has been tricked into the belief that FRN are money. A belief about reality does not mean the belief is true.
It is difficult to stay on point when there has been so much deception by the elites over every aspect of life in the Western world. Making one point, the importance of gold for example, has so much deceptive background about which few Americans are aware, some of what if said does not make sense unless and until one becomes aware of the deception that has been ongoing, not just recently, but since the time when America gained, [what almost all do not know was temporary] independence.
If more people realized the importance of owning physical gold and silver, relative to holding worthless fiat paper, they would be better off, but that is not going to happen. Even within the PM community, the focus is on how much one paid for their gold and or silver, relative to what the price is today.
The price is where it is today because it has been purposefully suppressed by Western central bankers to keep the "dollar" alive as the world's reserve currency. Destroy that, and gold and silver do, which is why PM are so despised by central banks, competing against their paper enslavement scheme, and the Western banking system collapses. The central bankers will not allow that to happen until they have destroyed every fiat currency, first, and along with that destruction, the "value" of whatever people hold in paper form: cash, stocks, bonds, pensions, etc. It is in process of happening and has been for decades. Right now, events are leading up to the final phase of the dollar to undergo severe devaluation.
People are focusing on the price of PMs, treating gold and silver as vehicles for increasing in price relative to their cost of purchase. It is the reason for buying and holding gold and silver that matters. As a consequence, attention is paid to what people think should happen to the price of gold and silver, and not on the reality of what the artificially suppressed market is showing.
For that reality, we turn to the charts because the very legitimate fundamentals that will ultimately drive the price of gold and silver are not a barometer for the timing of any future price increases. Plain and simple, gold and silver will not increase in price until the socialist/fascist central planners and their puppet governments have confiscated as much wealth as possible from the masses, leaving many destitute.
Know this: It does not matter what you pay/paid for owning physical gold and silver. Price is temporary; physical is permanent.
We caught an early portion of the rally in silver and gold but exited prior to the larger gains of the past week, or so. It has been frustrating to be on the sidelines, but it never pays to "chase" a market. The results from Trade Recommendations for February have been great, so far, and none this month's recommendations were derived from trying to catch a rally already underway, as in gold and silver.
No matter what phase a market is in, there will always be set-up opportunities that offer limited risk and a higher probability for a successful outcome, and that will also happen for gold and silver. As ongoing buyers of the physical, we are not too concerned about missing a rally or two in a down trending paper market. It is critical to know that one should always make decisions about the reality of a current market and not what one may think will happen in any given market.
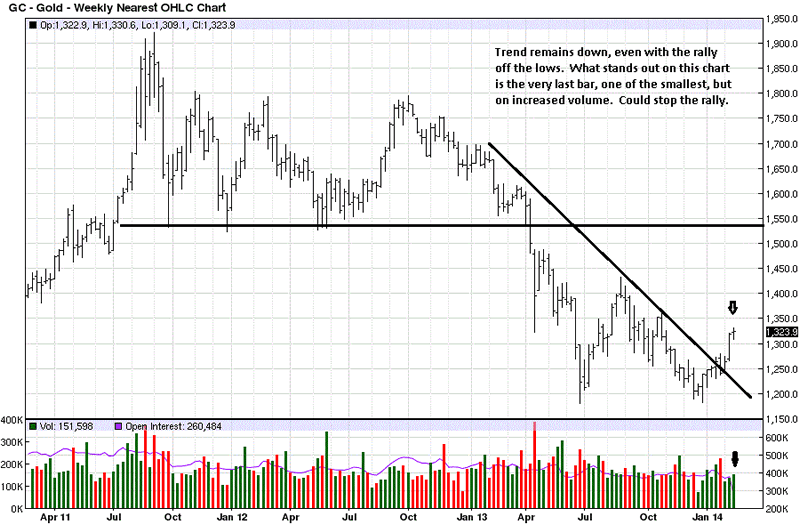
The weekly gold chart is a simple one. A red flag is in effect based on the increased volume and the very small weekly range that resulted. The message from the market for this specific situation is that the increased effort on the part of buyers was met, even overcome, by sellers who prevented buyers from extending the range more to the upside. The daily shows more detail.
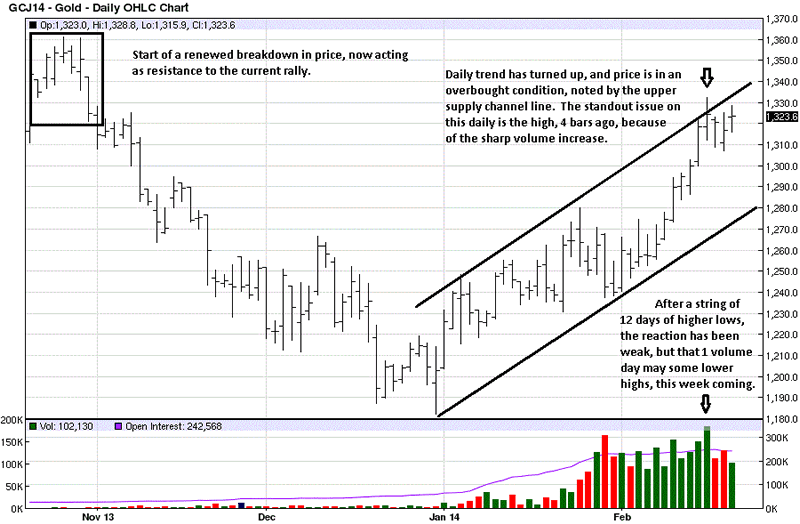
Charts are replete with information about past activity and how it can possibly influence present activity. The rectangular box on the left shows where price declined quickly from the 1360 level down to the 1320 area. [Resistance should always be considered as an area and not just a specific price.] The current rally in gold stopped, so far, at the 1330 area.
There are two important considerations to keep in mind. The upper channel line is a supply line that indicates when a market is in an overbought situation. What many fail to appreciate is that overbought can become more overbought, so it is not a reason, by itself, for making a trade decision.
The other aspect is the sharp increase in volume, which happened to occur at the overbought supply line at the same time. Whenever there is a sharp increase in volume, pay attention. It is the earmark of "smart money" stepping up activity. Smart money buys low, sells high. That is axiomatic.
Up until last Tuesday, the high volume day, gold made 12 successive higher lows. The increase in volume came at the high. Would you surmise smart money was buying or selling at that high day? The logic, to which we referenced earlier for those not too familiar with charts as we use them, would say smart money was selling.
Consider the facts taken directly from the chart. Price was in an area where it declined previously, last October, early November 2013. Price was also at an overbought condition, converging with these other two factual observations, as volume had a sharp increase. A logical conclusion can be drawn from those facts, [vs opinions which can be different from one person to another].
Will a correction develop soon, next week, based upon this information? We do not know, nor is it important to know what may happen, in advance. We have formulated an idea on what the market may do, but we have to wait and see if the market confirms the idea.
If it does confirm a correction is imminent, the next step is to prepare for an opportunity to possibly be a buyer. This approach to the market eliminates guesswork or having to make a prediction. Time will tell, starting next week. If the market rallies more, instead, we wait again for another opportunity that will develop. Markets do not disappoint.
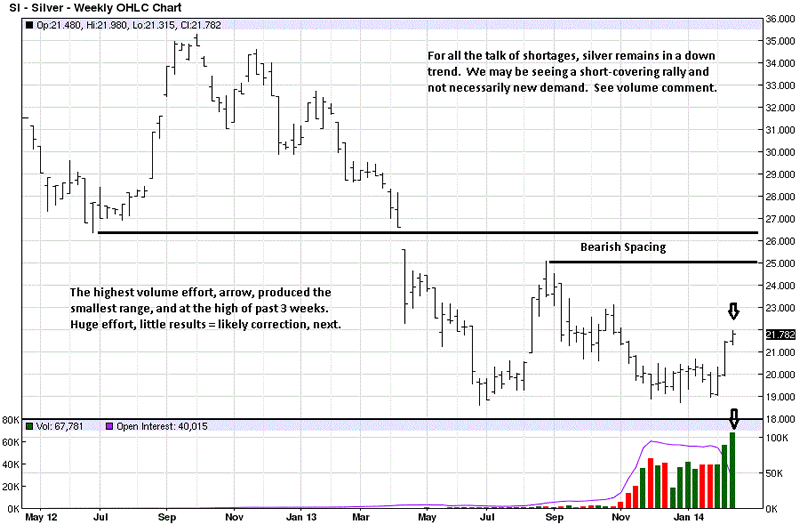
There is a growing sense that silver, so often overshadowed by gold, may be the key for when the PM begin to rally in earnest. For all the severe shortage of physical silver and mining issues for more supply, etc, the chart does not reflect any sense of urgency that silver is about to launch a major rally.
The issue of bearish spacing still exists, and the current rally is at the 50% area from the last swing high to low. Whenever a market does not rally past a half-way point, it is a general indication of overall weakness, emphasis on general.
Silver shows the same sharp volume increase and very small weekly range, relative to the effort expended. It is the daily that shows how charts show the way in which a market provides all the information one needs to make an informed trading decision.
People focus their attention on current market activity, even to the extent of using intra day charts as a reference for decision-making. There is too much "noise" from an intra day chart to be consistent. They are not the most reliable points of reference. It is always better to start with the higher time frames and work down.
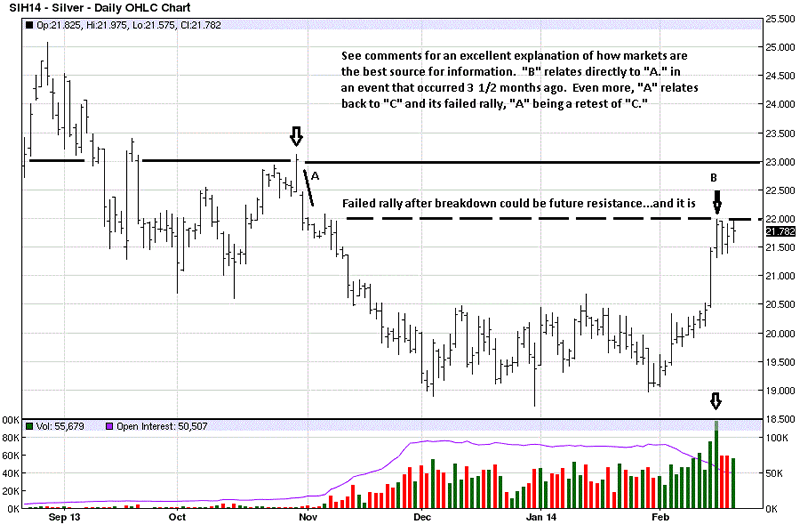
The weekly chart already indicated a red flag alert from the high volume and small range bar. We will start with that bar, "B" on the chart, but we see that specific day as a point of culmination, based upon past market activity. Just as with gold, silver had a failed rally at "A," see arrow.
We can see the market declined from that high, but what makes that high of greater importance is seeing how the market closed on 30 October. There was a wide range rally and strong close near the high. Logically, one would expect upside follow through, next day. What happened instead? Price gapped down, opening under the low of that rally bar, the exact opposite of expectations.
Whenever the market does something opposite to obvious expectation, that is an important message from the market itself! Pay close attention when that happens. The market failed to confirm the expectation. This gives greater credence to that area being resistance into the future. When we noted that "B" related directly to "A," you would not have likely made that pertinent observation.
Further, "A" relates back to "C," which we just realized was not marked on the chart. "C" is the last failed rally in the middle of September, where there was a very wide range bar, followed by a small bar, stopping the rally, and price sold off sharply, next trading day.
When you see how "C" acted, it puts "A" into a context that is less surprising. It is the combination of "C," "A," and the volume spike that strongly suggests "B" may also turn into a decline. By itself, "B" is not as strong a case for a potential reaction as when a "story" is developed from previous developed market activity.
While all of the focus is primarily on gold, silver is not in as relatively as strong a position as gold, and it may be a truer roadmap for when the eventual bull market emerges, at some as yet unknown point in the future. Whenever that rally starts, it is almost certain that the first signs will come from the charts, as described.
Stay tuned.
By Michael Noonan
Michael Noonan, mn@edgetraderplus.com, is a Chicago-based trader with over 30 years in the business. His sole approach to analysis is derived from developing market pattern behavior, found in the form of Price, Volume, and Time, and it is generated from the best source possible, the market itself.
© 2013 Copyright Michael Noonan - All Rights Reserved Disclaimer: The above is a matter of opinion provided for general information purposes only and is not intended as investment advice. Information and analysis above are derived from sources and utilising methods believed to be reliable, but we cannot accept responsibility for any losses you may incur as a result of this analysis. Individuals should consult with their personal financial advisors.
Michael Noonan Archive |
© 2005-2022 http://www.MarketOracle.co.uk - The Market Oracle is a FREE Daily Financial Markets Analysis & Forecasting online publication.