


Crude Oil Price Declines Slightly
Commodities / Crude Oil Feb 22, 2014 - 03:07 PM GMTBy: Nadia_Simmons

 Trading position (short-term): In our opinion no positions are justified from the risk/reward perspective.
On Thursday, crude oil moved lower as the U.S. dollar strengthened after solid U.S. economic data and stocks of distillates fell less-than-expected. Despite this small drop, light crude still remains near a 4-month high, slightly below $103 per barrel.
Yesterday, market research group Markit said that its preliminary U.S. PMI increased to 56.7 in February from a final reading of 53.7 in January (while analysts had expected a drop to 53.0 this month). Additionally, the Labor Department said in its report that initial claims for jobless benefits fell by 3,000 to 336,000 (slightly below expectations for a decline of 4,000), while U.S. consumer prices rose 1.6% on a year-over-year basis in January and core consumer prices (without food and energy costs) were also up 1.6% on a year-over-year basis (both in line with expectations). These solid U.S. economic data pushed the U.S. currency higher, making light crude more expensive for holders of other currencies and sending the price of the commodity lower.
Later in the day, the Federal Reserve Bank of Philadelphia said that its manufacturing index declined to -6.3 in February from January’s reading of 9.4 (while analysts had expected a drop to 8.0 in February). This weaker-than-expected number fueled concerns that U.S. recovery still faces headwinds and may demand less fuel and energy, which was an additional bearish factor for light crude.
Also yesterday, the U.S. Energy Information Administration showed in its weekly report that U.S. crude oil inventories rose by 973,000 barrels last week, less than market expectations for a gain of 2.01 million barrels. Although this was bullish news, inventories of distillates (which include diesel fuel and heating oil) disappointed market participants. The report showed that stocks of distillates fell by 339,000 million barrels, far less than market expectations for a loss of 1.89 million.
Having discussed the above, let’s move on to the technical changes in crude oil (charts courtesy of http://stockcharts.com).
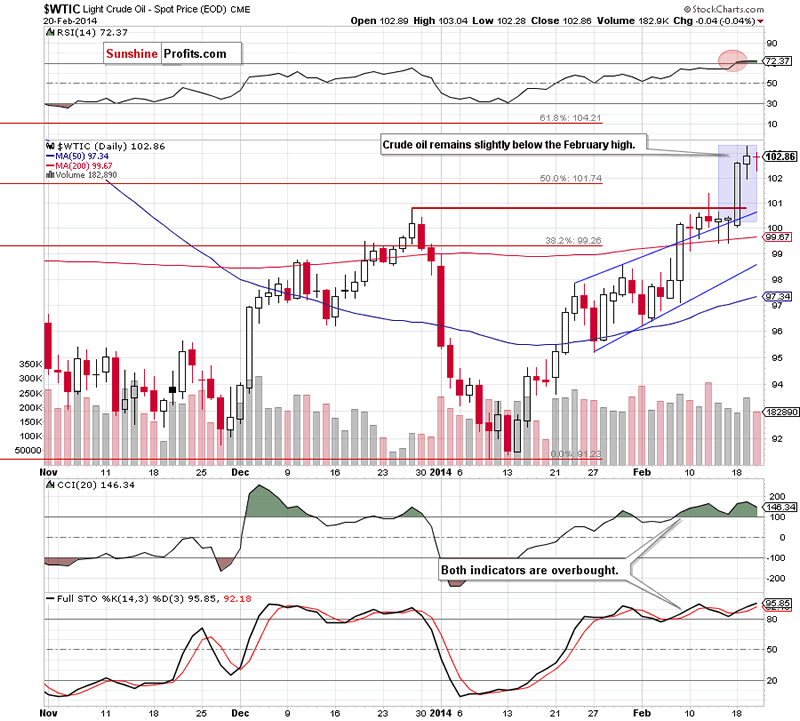
As you see on the daily chart, the situation hasn’t changed much as crude oil remains between Tuesday high and low. If the 127.2% Fibonacci extension level based on the Dec.-Jan. decline (around $103.34) encourages oil bears to act, we may see a pullback in the coming day (or days). In this case the first downside target for the sellers would be a support zone created by the December peak, the previous February high and the upper line of the rising trend channel. Although this scenario is reinforced by the current position of the indicators (they are all overbought), none of them generated a buy signal, which means that another attempt to reach the 61.8% Fibonacci retracement level can’t be ruled out.
Having discussed the current situation in light crude, let’s take a look at WTI Crude Oil (the CFD).
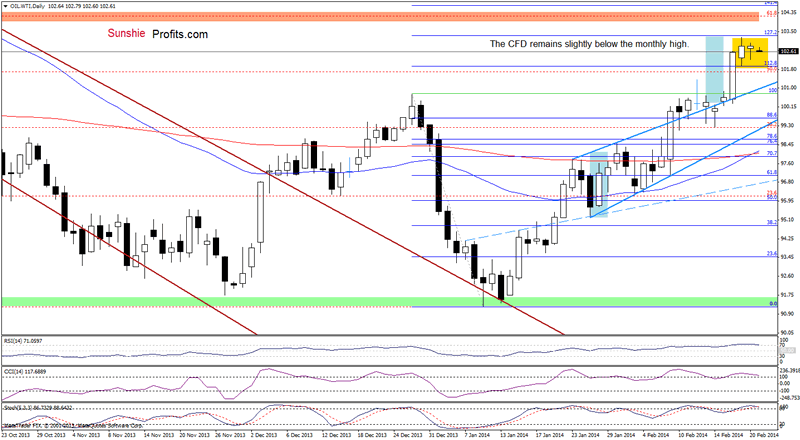
Looking at the above chart, we see that the situation hasn’t changed much as WTI Crude Oil remains in a consolidation slightly below the monthly high, which corresponds to the 127.2% Fibonacci extension level (based on the Dec.-Jan. decline). Taking these circumstances into account, what we wrote in our last Oil Trading Alert is still up-to-date.
(…) If this strong resistance encourages sellers to act, we will likely see a pullback in the coming day (or days) and the first important support will be the previously-broken upper border of the rising trend channel/rising wedge. This scenario is currently reinforced by the position of the indicators - the CCI and Stochastic Oscillator are not only overbought, but there are also negative divergences between them and the CFD (…) Nevertheless, from this perspective, the situation is still bullish (a current decline is much smaller than the previous one) and if the CFD reverses, the next target for the buyers will be the 61.8% Fibonacci retracement, which corresponds to the October high.
Please note that the RSI climbed above the level of 70 once again, while the Stochastic Oscillator generated a sell signal, which provides us with bearish implications.
Summing up, the current situation in crude oil hasn’t changed much as light crude remains below the 127.2% Fibonacci extension level, which is a strong resistance level. As mentioned earlier, all indicators are overbought (also in the case of the CFD), which
suggests that a pause or a pullback is just around the corner. Please note that even if crude oil climbs once again, it seems that the space for further growth will be likely limited by the 61.8% Fibonacci retracement level.
Very short-term outlook: mixed
Short-term outlook: bullish
MT outlook: bullish
LT outlook: mixed
Trading position (short-term): In our opinion, opening long positions at the moment is not a good idea as the space for further growth seems limited and the position of the indictors suggests that we may see a correction in the coming days.
Thank you.
Nadia Simmons
Sunshine Profits‘ Contributing Author
Oil Investment Updates
Oil Trading Alerts
* * * * *
Disclaimer
All essays, research and information found above represent analyses and opinions of Nadia Simmons and Sunshine Profits' associates only. As such, it may prove wrong and be a subject to change without notice. Opinions and analyses were based on data available to authors of respective essays at the time of writing. Although the information provided above is based on careful research and sources that are believed to be accurate, Nadia Simmons and his associates do not guarantee the accuracy or thoroughness of the data or information reported. The opinions published above are neither an offer nor a recommendation to purchase or sell any securities. Nadia Simmons is not a Registered Securities Advisor. By reading Nadia Simmons’ reports you fully agree that he will not be held responsible or liable for any decisions you make regarding any information provided in these reports. Investing, trading and speculation in any financial markets may involve high risk of loss. Nadia Simmons, Sunshine Profits' employees and affiliates as well as members of their families may have a short or long position in any securities, including those mentioned in any of the reports or essays, and may make additional purchases and/or sales of those securities without notice.
© 2005-2022 http://www.MarketOracle.co.uk - The Market Oracle is a FREE Daily Financial Markets Analysis & Forecasting online publication.