


Relentless Stocks Bull Market
Stock-Markets / Stock Markets 2014 Feb 18, 2014 - 10:01 AM GMTBy: Tony_Caldaro

 The market opened the week at SPX 1797, dipped to 1792 early Monday, then rallied with only one notable pullback to 1842 by Friday. And all this occurred during market hours, as the only gap opening on the week was a lower one on Thursday. For the week the SPX/DOW gained 2.3%, the NDX/NAZ gained 2.9%, and the DJ World index rose 2.4%. On the economic front negative reports again outpaced positive ones. On the uptick: wholesale/business inventories, export/import prices and the M1-multiplier. On the downtick: retail sales, industrial production, capacity utilization, the WLEI, plus the budget deficit and weekly jobless claims increased. Next week we get reports on the NY/Philly FED, the CPI/PPI and Housing.
LONG TERM: bull market
The bull market of 2009 is now in its fifth year. Historically five years is just about as old as they get. Since 1929 there have been 13 bull markets, and only one lasted more than 5 years. Probabilities suggest this one will end this year in 2014.
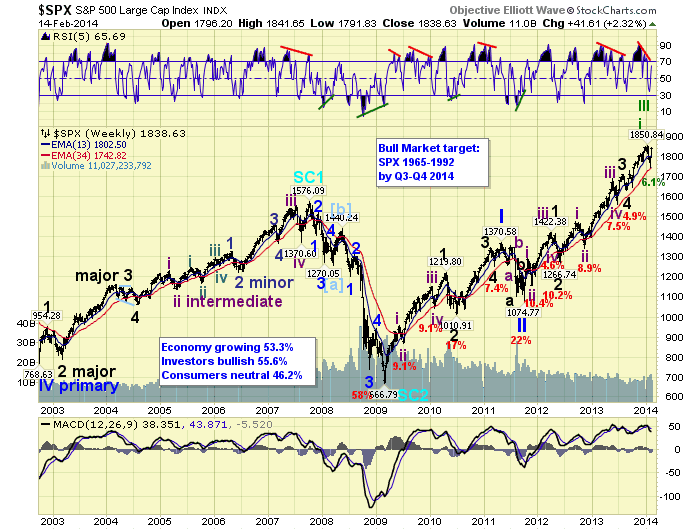
We continue to count this bull market as Cycle wave [1] of the new Super cycle 3. Cycle wave bull markets unfold in five Primary waves. Primary waves I and I ended in 2011, and Primary III has been underway since then. Primary III may have topped recently, however, the probability of that is gradually decreasing. Primary wave I divided into five Major waves with a subdividing Major wave 1. Primary III has also divided into five Major waves, but both Major waves 1 and 3 subdivided. Should the current rally make new highs Major wave 5 is probably subdividing as well. When Primary III does end, a substantial Primary IV correction will follow. Then a Primary wave V to new highs will end the bull market. It appears Primary IV may coincide with the four-year Presidential cycle low expected this year.
MEDIUM TERM: uptrend probable
When the downtrend from SPX 1851 to 1738 started to gain some momentum we anticipated that the high was either the end of Primary wave III, or Intermediate wave one of Major wave 5. Posting one count on the SPX charts, and the other on the DOW charts. We tracked the downtrend as it unfolded in a 5-3-5 zigzag pattern right into low at SPX 1738 a week ago Wednesday. That day we suggested a rally should follow into the 1790′s area. When the market reached the 1790′s last Friday it appeared it had more to go on the upside.
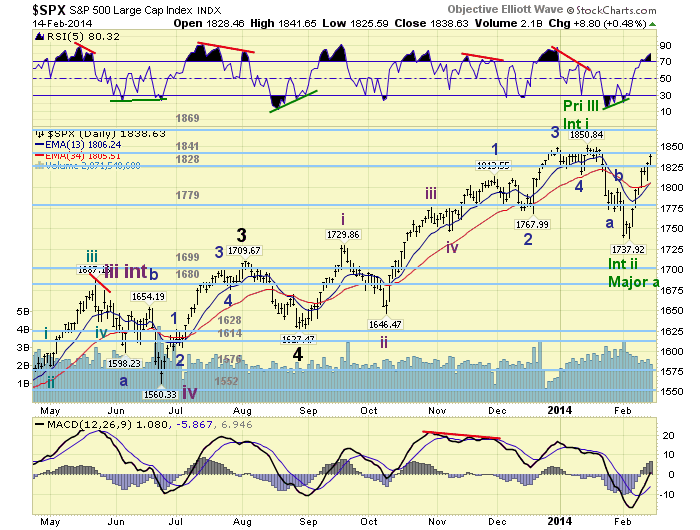
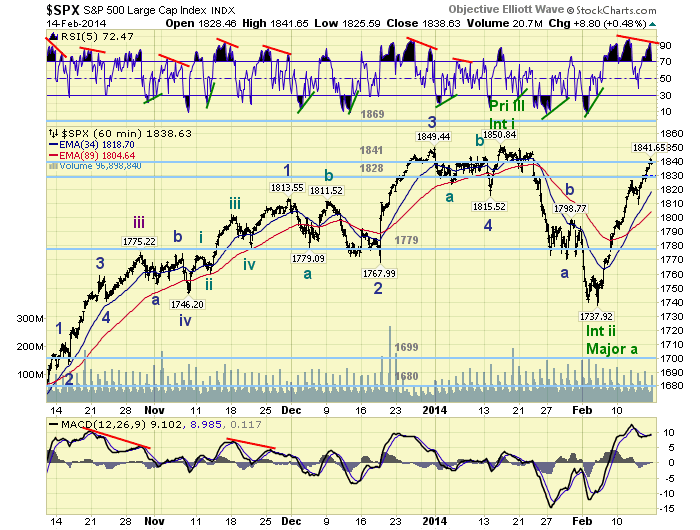
Over the weekend we suggested SPX 1814 would determine if the downtrend had ended at 1738, or there was more to go on the downside. This Tuesday the market surged right past SPX 1814 suggesting the downtrend had ended. For the rest of the week the market continued to move higher until it hit SPX 1842 one hour before the close on Friday. While the SPX 1814 level had suggested an uptrend/downtrend going forward. The SPX 1851 level will now likely suggest either Intermediate iii of Major 5 is underway, or Major wave B of Primary IV. We have updated the charts to display these two counts on both the SPX and DOW. Medium term support is at the OEW 1828 and 1779 pivots, with resistance at the 1841 and 1869 pivots.
SHORT TERM
Short term support is at the 1828 pivot and SPX 1814, with resistance at the 1841 pivot and SPX 1851. Short term momentum ended the week extremely overbought, with a negative divergence. The short term OEW charts remain positive with the reversal level now at SPX 1819.
The rally from SPX 1738 has thus far unfolded in five waves: 1788-1777-1827-1809-1842. You will note the first and third waves were equal at 50 points each. This suggests the fifth wave (1809-1842 thus far) should be the shortest. Should the market complete the fifth wave within the OEW 1841 pivot range we would expect a pullback into the 1809 area, the level of the previous 4th wave. Should this notable pullback drop back to the 1779 pivot we would expect the rally was over.
On the upside, a continuation beyond SPX 1859, without a notable pullback, would suggest two things. First the recent SPX 1738 low was the end of Int. wave two, and Int. three is underway. Second, the rally off the low was a 1-2-1-2 pattern and wave 3 is underway. While there are still a few variables at play until the market firms the short/medium term counts. Just remember we are still in a bull market.
FOREIGN MARKETS
The Asian markets were mostly higher for a net gain of 1.8%.
The European markets were all higher for a net gain of 2.2%.
The Commodity equity group were mostly higher for a net gain of 0.8%.
The DJ World index gained 2.4% on the week.
COMMODITIES
Bonds remain in an uptrend but lost 0.1% on the week.
Crude is uptrending and gained 0.2% on the week.
Gold’s uptrend finally moved higher gaining 4.1% on the week.
The USD is back in a downtrend and lost 0.7% on the week.
NEXT WEEK
Monday is a holiday. Tuesday: the NY FED at 8:30 and NAHB housing at 10am. Wednesday: Housing starts, Building permits, the PPI and the FOMC minutes. Thursday: weekly Jobless claims, the CPI, the Philly FED and Leading indicators. Friday: Options expiration and Existing home sales. The FED will have an open board meeting on Tuesday at 3:15 on banking. Best to your three-day weekend and week!
CHARTS: http://stockcharts.com/public/1269446/tenpp
http://caldaroew.spaces.live.com
After about 40 years of investing in the markets one learns that the markets are constantly changing, not only in price, but in what drives the markets. In the 1960s, the Nifty Fifty were the leaders of the stock market. In the 1970s, stock selection using Technical Analysis was important, as the market stayed with a trading range for the entire decade. In the 1980s, the market finally broke out of it doldrums, as the DOW broke through 1100 in 1982, and launched the greatest bull market on record.
Sharing is an important aspect of a life. Over 100 people have joined our group, from all walks of life, covering twenty three countries across the globe. It's been the most fun I have ever had in the market. Sharing uncommon knowledge, with investors. In hope of aiding them in finding their financial independence.
Copyright © 2014 Tony Caldaro - All Rights Reserved Disclaimer: The above is a matter of opinion provided for general information purposes only and is not intended as investment advice. Information and analysis above are derived from sources and utilising methods believed to be reliable, but we cannot accept responsibility for any losses you may incur as a result of this analysis. Individuals should consult with their personal financial advisors.
Tony Caldaro Archive |
© 2005-2022 http://www.MarketOracle.co.uk - The Market Oracle is a FREE Daily Financial Markets Analysis & Forecasting online publication.