


Oil Trading Alert: Crude Oil Price Hits Fresh Monthly High
Commodities / Crude Oil Feb 14, 2014 - 08:54 AM GMTBy: Nadia_Simmons

 Trading position (short-term): In our opinion no positions are justified from the risk/reward perspective.
On Wednesday, crude oil rose on better than expected economic data from China and climbed to its highest level since late October. Despite an increase to a fresh monthly high, light crude reversed after the EIA data showed that crude inventories rose more than expected. In this way, crude oil lost 0.11%, but closed the day above $100 per barrel.
Yesterday's data showed that China's trade surplus widened to $31.86 billion last month from $25.6 billion in December, beating expectations for a $23.65 billion surplus. Additionally, Chinese exports climbed 10.6% from a year earlier, beating expectations for a 2% increase and following a 4.3% gain in December. Imports rose 10%, compared to forecasts for a 3% increase. Please note that according to preliminary customs data, Chinese imports of crude oil hit an all-time monthly high in January (China imported 28.16 million metric tons of crude oil, equivalent to 6.66 million barrels a day, which is 12% above the year-ago level.).
Despite this positive data, which encouraged the buyers to push the price higher, crude oil reversed and gave up earlier gains after the U.S. Energy Information Administration showed in its weekly report that U.S. crude oil inventories rose by 3.3 million barrels in the week ended Feb. 7 compared to expectations for an increase of 2.7 million barrels (it was the fourth weekly gain for domestic crude supplies).
Having discussed the above, let's move on to the technical changes in crude oil (charts courtesy of http://stockcharts.com).
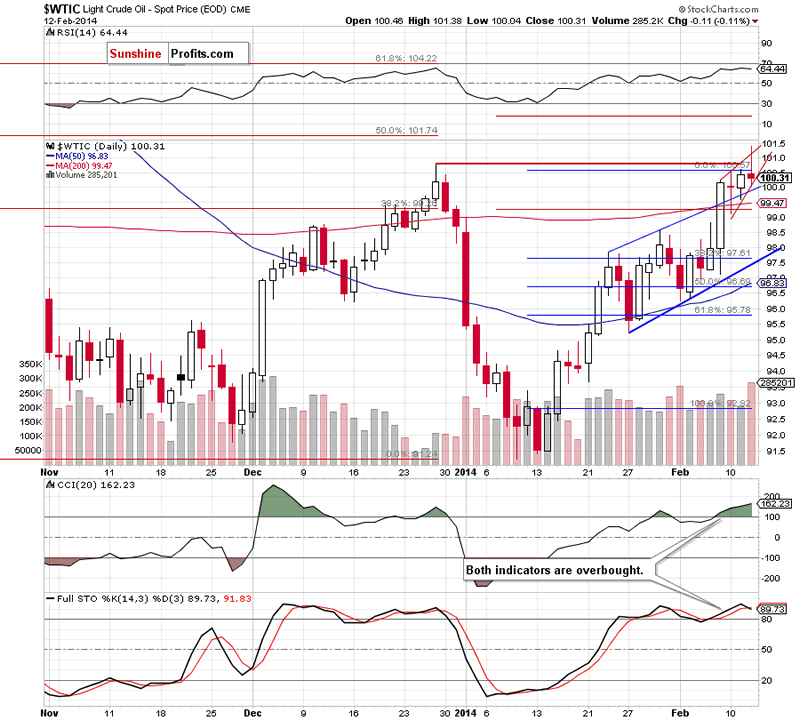
On the above chart, we see that crude oil broke above the December peak and hit a fresh monthly high of $101.38. Although this was a strong bullish signal, we didn't see further improvement and light crude reversed before reaching its upside target (the 50% Fibonacci retracement level). An invalidation of the breakout was a bearish signal, which encouraged sellers to act and resulted in a drop to the lower border of a small rising wedge (marked in red on the above chart). With this downswing, light crude also approached the upper border of the rising trend channel (marked with blue).
From this perspective, we should consider two scenarios once again. On one hand, if this support zone encourages oil bulls to act, we may see another attempt to move higher. However, taking into account the fact that yesterday's drop materialized on relative large volume (which confirms the strength of the sellers) and combining it with an invalidation of the breakout above the December high and the current position of the indicators, it seems that we will likely see further deterioration in the coming day (or days). Additionally, if the price drops below the lower border of a small rising wedge, we will see an invalidation of the breakout above the upper border of the rising trend channel, which will be a bearish signal. If this is the case, the downside target will be the lower border of the rising trend channel (currently around $97.50). Please note that the CCI and Stochastic Oscillator are overbought, which suggests that a correction is just around the corner.
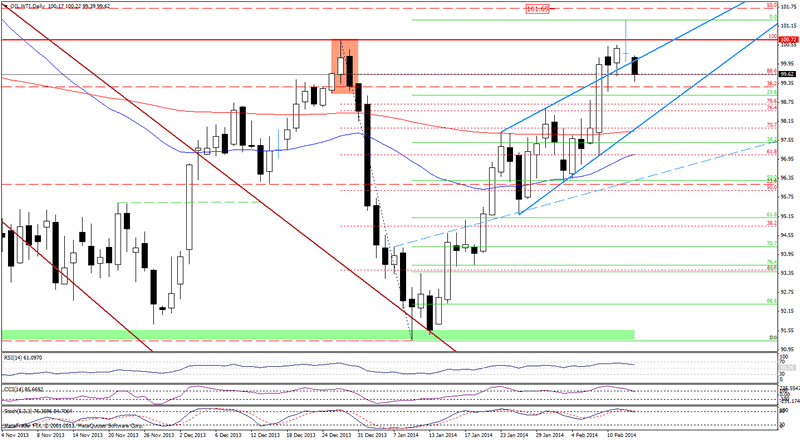
Having discussed the current situation in light crude, let's take a look at WTI Crude Oil (the CFD).
Quoting our last Oil Trading Alert:
(...) WTI Crude Oil almost touched the December high (which is still reinforced by a bearish engulfing candlestick pattern)(...) if the CFD breaks above this important resistance level, we will likely see further increases and the first upside target will be the 50% Fibonacci retracement level around $101.70.
As you see on the above chart, WTI Crude Oil broke above the December high, but the buyers didn't manage to push the CFD to its upside target, which was a first bearish sign. In the following hours, the price also dropped below the previously-broken resistance level and declined to the upper border of the rising trend channel (which actually looks like a rising wedge from this perspective). Earlier today, we saw further deterioration as the CFD declined below this important support line. If oil bulls manage to invalidate this breakdown, we may see an upswing to yesterday's high. However, if they fail and WTI Crude Oil closes the day below the upper border of the rising trend channel (rising wedge), it will be a strong bearish signal that will likely trigger further deterioration. At this point it's worth noting that the Stochastic Oscillator and CCI generated sell signals, which is a bearish signal that may encourages sellers to act.
Summing up, although crude oil hit a fresh monthly high, it quickly reversed and erased earlier gains. As mentioned earlier, an invalidation of the breakout is a bearish signal (especially when we take into account the fact that yesterday's drop materialized on relative large volume and the current position of the indicators), which will likely trigger further deterioration in the coming day (or days). On top of that, the current situation in the CFD (sell signals generated by the CCI and Stochastic Oscillator) supports oil bears. So, if light crude drops below the lower border of a small rising wedge, we will see an invalidation of the breakout above the upper border of the rising trend channel and probably a bigger pullback (if this is the case, the downside target will be the lower border of the rising trend channel, currently slightly above $97). Connecting the dots, all the above suggests that a correction is just around the corner.
Very short-term outlook: mixed
Short-term outlook: bullish
MT outlook: bullish
LT outlook: mixed
Trading position (short-term): In our opinion, as long as there is no an invalidation of the breakout above the upper line of the rising trend channel, the situation will not be bearish enough to justify opening short positions. We will keep you informed should anything change, or should we see a confirmation/invalidation of the above.
Thank you.
Nadia Simmons
Sunshine Profits‘ Contributing Author
Oil Investment Updates
Oil Trading Alerts
* * * * *
Disclaimer
All essays, research and information found above represent analyses and opinions of Nadia Simmons and Sunshine Profits' associates only. As such, it may prove wrong and be a subject to change without notice. Opinions and analyses were based on data available to authors of respective essays at the time of writing. Although the information provided above is based on careful research and sources that are believed to be accurate, Nadia Simmons and his associates do not guarantee the accuracy or thoroughness of the data or information reported. The opinions published above are neither an offer nor a recommendation to purchase or sell any securities. Nadia Simmons is not a Registered Securities Advisor. By reading Nadia Simmons’ reports you fully agree that he will not be held responsible or liable for any decisions you make regarding any information provided in these reports. Investing, trading and speculation in any financial markets may involve high risk of loss. Nadia Simmons, Sunshine Profits' employees and affiliates as well as members of their families may have a short or long position in any securities, including those mentioned in any of the reports or essays, and may make additional purchases and/or sales of those securities without notice.
© 2005-2022 http://www.MarketOracle.co.uk - The Market Oracle is a FREE Daily Financial Markets Analysis & Forecasting online publication.