


Trader / Investor Tip- How to Determine that the Market is Overbought
InvestorEducation / Learn to Trade Apr 22, 2008 - 01:09 PM GMTBy: Marty_Chenard

 Upwardly moving markets or stocks all eventually move up into overbought conditions. Then ... they cool down in order to let some of the steam off.
How do you measure the steam level? One way is to look at a very short term Relative Strength reading. On a daily chart, I personally like to look at an RSI of 3.
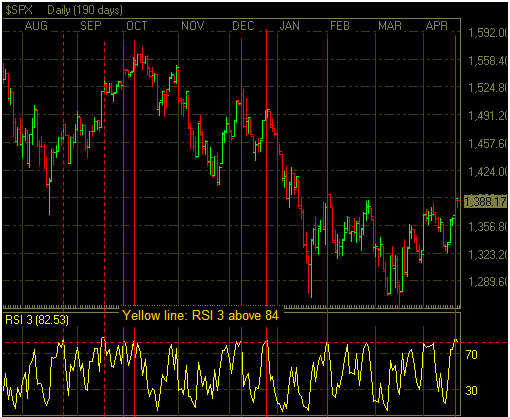
The chart below shows a RSI 3 chart going back to last August. I drew a horizontal red dotted line across the RSI where it was at a level of 84 or higher. Traditionally, a reading of 70+ is regarded as an overbought condition. An 84+ reading is an extreme overbought reading.
If you follow the red vertical lines, you can see that each 84+ RSI reading had an intra-day pull back the next day, or shortly thereafter.
What was the RSI 3 reading on the S&P 500 during the last two days?
It was 88.21 on Friday's close, and then 82.53 on a pullback at yesterday's final close. If the market had seen a strong pull back yesterday, it would have dissipated a lot of that overbought level. It didn't ... so the market remained with an extreme RSI level again yesterday. That now leaves the S&P with more steam to blow off in order to reach an equilibrium level on the RSI.
RSI (Relative Strength Indicator) tools like this are helpful indicators for investors. However, they should be used in conjunction with other indicators to take into account the trending movement's profile and important Red Flag divergences that tell more of the story. (A more extensive RSI 3 study with an additional indicator can be found on our paid subscriber site today.)
By Marty Chenard
http://www.stocktiming.com/
Please Note: We do not issue Buy or Sell timing recommendations on these Free daily update pages . I hope you understand, that in fairness, our Buy/Sell recommendations and advanced market Models are only available to our paid subscribers on a password required basis. Membership information
Marty Chenard is the Author and Teacher of two Seminar Courses on "Advanced Technical Analysis Investing", Mr. Chenard has been investing for over 30 years. In 2001 when the NASDAQ dropped 24.5%, his personal investment performance for the year was a gain of 57.428%. He is an Advanced Stock Market Technical Analyst that has developed his own proprietary analytical tools. As a result, he was out of the market two weeks before the 1987 Crash in the most recent Bear Market he faxed his Members in March 2000 telling them all to SELL. He is an advanced technical analyst and not an investment advisor, nor a securities broker.
Marty Chenard Archive |
© 2005-2022 http://www.MarketOracle.co.uk - The Market Oracle is a FREE Daily Financial Markets Analysis & Forecasting online publication.