


Stock Market Fat Lady Has Yet To Sing. Some Questions About YOUR Stocks?
Stock-Markets / Stock Markets 2014 Feb 10, 2014 - 10:21 AM GMTBy: Michael_Noonan

 The opposite sentiment of "gold fever" has been apparent in the stock market, of late, with so many calls for a top and/or a crash. Gold has not rallied to higher levels called for, and the stock market has not fallen to levels that resemble a crash.
Trust in the Fed a little more. That criminal body is not about to let the market go down without more of a taper fight. It is not yet game over, at least for the market in general. The same may not be true of individual stocks within one's portfolio, and that is where the focus should lie.
It is no secret that the stock market has been kept alive buy the Fed feeding the market intravenously through paper derivatives. This does not mean individual stocks are the recipient of the foreign, corporate-owned Fed's fiat financial largesse.
IF you happen to own those stocks that are on the plus side of the indexes, you should be doing well. However, if your portfolio consists of any stocks that are weighing on the down side of the major indexes, it may be time to take some action similar to those contestants on The Biggest Loser, [A weight-loss reality show], and shed some unwanted losers that reduce the value of what you hold because you want to only have gains.
Ask yourself a simple question: What was the purpose of investing in the stock market?
Was it to make money, or to lose it?
If your objective was to make money, ask another simple question: Are your stocks showing a positive return?
To the extent that there are profits, ask yourself another question: Do you have a plan to protect those profits?
On the flip side, if you have stocks that are showing losses, the obvious question is: Why do you still own them?
The most important question of all: Do you have a plan to limit your loss exposure?
The approach to the stock market does not have to be very sophisticated. Just asking a few pointed questions helps develop a context for taking control of your own financial well-being. Trust yourself to have the greatest interest in your own money and how it is handled. If you cannot trust yourself and place that trust in someone else, ask those same questions of that someone else, and do not take equivocation in response. The last thing you want in your financial corner is ambiguity.
We will start with a review of the market, using the widely followed S&P.
All of these calls for huge drops in the stock market are attempts to grab attention just from their headlines. What it says to us is that the authors do not understand market turns, for there has been no market change that would prompt one to run for the doors. That being said, there is every reason to be reviewing each and every stock owned in one's portfolio, which is precisely what we advocated back in December, and even before that, as a matter of form to protect one's capital. To do otherwise is simply financially irresponsible.
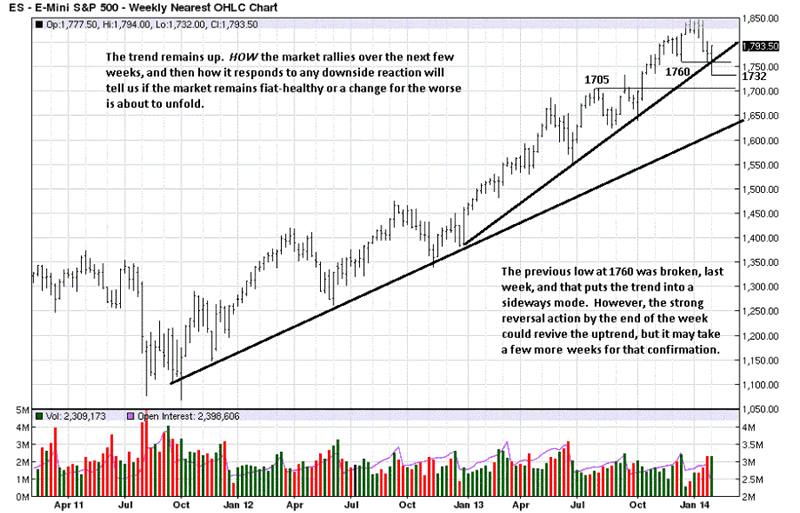
The monthly trend remains up, [not shown because it is too early in the month for the chart to be otherwise meaningful], but the weekly trend has weakened. A weakened trend does not mean it has turned down, at all. It takes time to reverse a trend, and with the stock market being Fed-driven, we suspect central planners will drag this one out before being forced to abandon their "plan."
What to watch for now, after reading the chart comments, is to observe the character of this developing rally, and just as important, the next reaction lower. The market has already shown strength in the recovery that began Friday. Can it be sustained is what to watch for in the next several TDs? [Trading Days]
The next reaction, if the market is to continue higher, should show smaller bars and declining volume, indicating sellers are not that strong. Should the next correction lower show increased EDM, [Ease of Downward Movement], poor close location on the bars, and increased volume, especially if the Friday low is taken out, this market is in trouble.
The character of this current developing rally will give us a more immediate clue. If price makes a lower swing high and then turns down, or makes a new high that is a failed probe and immediately sells off, this will be a huge warning that the market highs may be in.
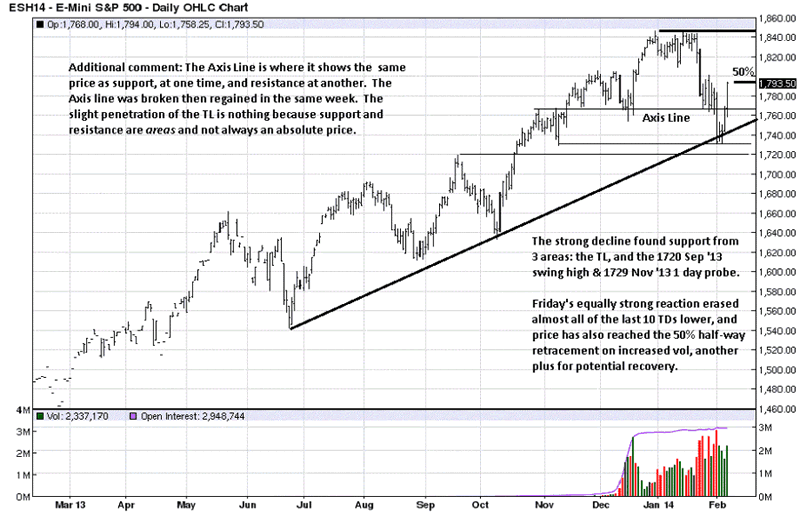
The daily chart is a perfect example of the importance of waiting for confirmation. For a few days, the market looked like the bottom was falling out, but it stopped on Wednesday. We missed monitoring the intra day activity, that day, and did not review it until the evening, but there was a clear buy signal, based on specific rules we have set up, that indicated a rally would follow. The buy signal trigger was at 1742, as an indication of how sensitive the intra day reads can be.
The kicker is where developing market activity was at the time: at potential TL support, and at the Sept '13/Nov '13 potential support area. Missing good trades is part of trading. It is the penalty for not being prepared. The offset to that is: good trades come along all the time. We never know when, like last Wednesday, but there is always another one.
As with the weekly, we need to see where the current developing rally ends, and then pay close attention to how the next reaction unfolds. The weaker the reaction the better. Weak reactions lead to higher prices. That is a market message axiom to keep in mind.
We posted a Commentary, Rising Market Does Not Lift All Stocks, on 7 December 2013. The opening paragraph stated:
We advocate a proactive stance in managing one's stock portfolio as the most prudent way to preserve and grow capital, by capturing gains and limiting risks. The days of buy and hold are finished, at this stage of a central bank propped-up market, fed by fiat and highly questionable reports issued by the Bureau of Lies, which seems an accurate assessment.
Certain market observations should be translated into rules, not to be broken, in order to preserve gains and limit losses on stocks already owned, and rules to limit exposure to risk that will prompt a sell whenever a stock does not perform positively.
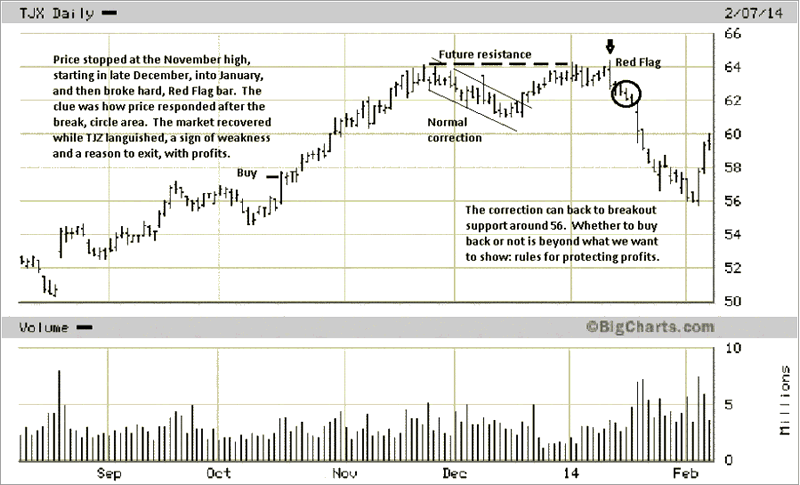
TJX was used as an example of how to buy proven performers in a trend, [4th chart in the above link], and the buy area is shown below, along with an update.
We do not trade stocks, but a chart is a chart, and the comments on the chart are exactly how we would trade any market. When reduced to price and volume, all markets are the same to us.
The November high was followed by a normal correction. A dashed horizontal line was drawn to the right, using a dashed to show that it was extending into the future, prior to when price was to subsequently develop, after that high. You can see how price stopped at the same level in late December, early January.
The OKR, [Outside Key Reversal], noted by the down arrow was a red flag, maybe even sufficient to exit and take profits, or at least partial. For sure, when TJX began to sell off more, circle area, the general market was rallying, and this would have been enough reason to exit the trade.
The point of doing this review exercise, and with the next two charts to follow, is to get you to actively manage your stock portfolio to preserve gains, but more importantly, to reduce risk exposure. Professional traders are more concerned with risk exposure than with taking profits. If you have a set of rules to participate in a trend, you will hold only those stocks that show greater ability to outperform the general market.
The problem with many stocks in many portfolios is that they are underperforming the general market, but they are not being sold out, reducing risk. Why not? In the minds of many inexperienced investors, they hope their underperforming stocks will catch up to the rest of the market. There is a valid reason why stocks are underperforming, and that is a very clear message from the market! Ignore it at your own financial peril.
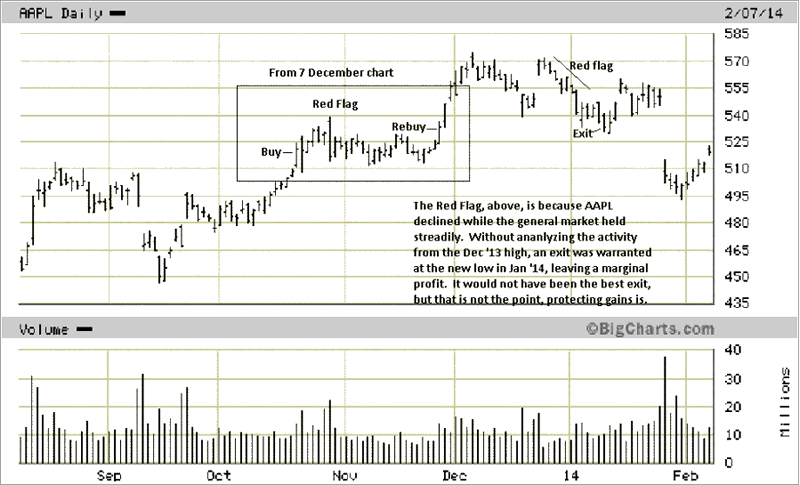
AAPL is a great example because its performance is not just up, then a sell signal, and down. Markets unfold in an infinite number of ways. The boxed activity from last Fall was how we saw the market, same link above from 7 December 2013.
Not marked on the chart are two Red Flag days in December: the high, 4th bar of the month. It was a new high, small range and a poor close on fairly high volume, at the time. Four bars later, there is a similar bar, but wider, indicating more selling, and a poor close. If one did not exit then, there was every reason to place a sell stop just under that low. It would have been triggered, two TDs later. Stopped out with a profit.
This is just our way of approaching the market. We use it because it works for us on a consistent basis. There are many other ways, and however one chooses to participate in the markets, it has to suit your own personal risk/reward factors.
Price did go lower and then had another rally, but the rally failed to make new highs. The Red flag, starting in late December early January, was due to the fact that AAPL was under performing the general market, a sign of weakness, and a reason to be alert for change.
If you cover up the rest of the chart, from January on, you can see where decisions to buy and sell were made, based upon developing market activity, information generated by the market itself, [always the best, most reliable source]. There were signs of weakness that indicated how to respond, and we knew that in present tense time. We did not have to know what would happen in the future, from that point on.
Uncover the rest of the trading activity from the beginning of January to now, and you can see how paying attention to the messages of the market has its rewards. It may not be perfect, no trading plan is, but it is profitable, on balance, and being profitable is the main objective, is it not?
If you hold any stocks that are underperforming the general indexes, you do not have a plan, and you do not have any rules that will protect and grow your capital. If you do not have both a plan and rules, you should not be in the market. Better to write a check for $500 or $1,000 to your broker, and keep the rest of your money out of the market. At least then you cannot lose any more money.
No offense to anyone not making money in the markets during the biggest bull move in history, [except the Nasdaq]. Losing money is easy. Making money is not always easy, but with a market plan and a set of rules, one can consistently be profitable. These few charts, and the reasons for participating in them, illustrate that point quite clearly.
It is not magic. There is no guess-work, no hoping the market will do one thing or the other. The markets are neutral. It is not what the markets do to you, it is what you do about what the markets are saying, at any point in time. The markets are always sending a message.
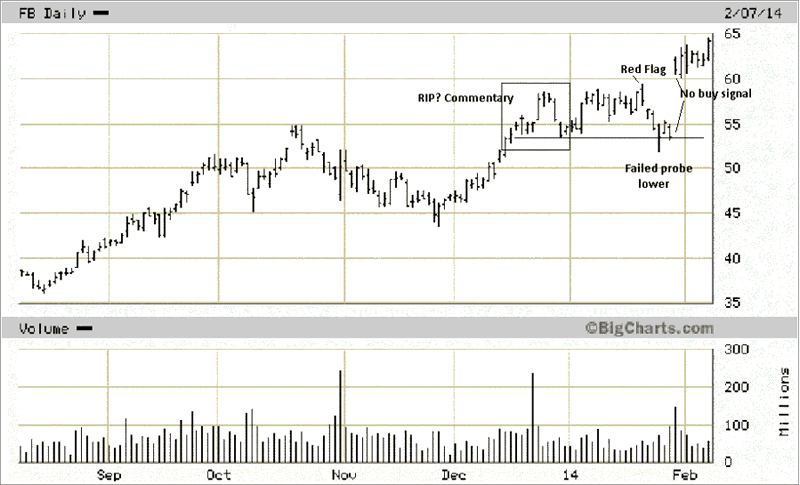
This is not to imply that the markets are an easy read. We wrote about Facebook on 29 December, A Shot Across The Bow. RIP?. The stock was not an easy read, and we had a negative bias toward it as a social media phenomenon that was subject to social whims as its business model, i.e. advertising as it source of revenue.
The caution, noted at the time, was well taken. Watching the stock occasionally since then, to see if it would fail, there was never any downside confirmation. It was close, in late January, but the close of the new low that day was at the high, much like the S&P close last Friday, and FB did an about face and rallied to current highs. Would we have bought it?
No.
The gap opening created too much risk to the downside to warrant a long position. There are also some trades we do not mind missing. FB is one of them.
We provide individual stock analysis, for a fee, just as the ones we post in all our commentaries. Contact mn@edgetraderplus.com, if interested.
By Michael Noonan
Michael Noonan, mn@edgetraderplus.com, is a Chicago-based trader with over 30 years in the business. His sole approach to analysis is derived from developing market pattern behavior, found in the form of Price, Volume, and Time, and it is generated from the best source possible, the market itself.
© 2014 Copyright Michael Noonan - All Rights Reserved Disclaimer: The above is a matter of opinion provided for general information purposes only and is not intended as investment advice. Information and analysis above are derived from sources and utilising methods believed to be reliable, but we cannot accept responsibility for any losses you may incur as a result of this analysis. Individuals should consult with their personal financial advisors.
Michael Noonan Archive |
© 2005-2022 http://www.MarketOracle.co.uk - The Market Oracle is a FREE Daily Financial Markets Analysis & Forecasting online publication.