Taking Stock Of Silver Stocks – SLW, PAAS, CDE, AG, SSRI, HL
Commodities / Gold and Silver Stocks 2014 Feb 05, 2014 - 10:40 AM GMTBy: Michael_Noonan
 We are of the simple opinion that any substitute for the real thing is never as good a
choice as the original, even when it comes to Precious Metals. There are so many other
considerations that enter the picture when regarding mining stocks. One of the primary
ones is management, what it can do to a stock’s performance separate and apart from its
underlying purpose, silver production. There can be poor management, mismanagement,
decision-making related to stock performance instead of getting the maximum
performance out of its mining operations, overspending, misspending…you get the idea.
Here is a reading of some of the top silver mining companies from a chart perspective. Charts show the best bottom line results from all observations one can make in an assessment of any company. While we see it as a way of cutting through everything else, this shortened version of viewing a company from a purely results-oriented perspective, via reading a chart, should not be quickly dismissed. In fact, from this kind of look, one might more easily see the value in dismissing some of the stocks as buy candidates.
Another important consideration to be held in mind is to always buy strength over weakness. Do not buy a stock because it is low, and you think it may rally and play “catch-up” with the rest of the market. There are very valid reasons why any stock is weaker, relative to other companies in the same sector.
In no particular order:
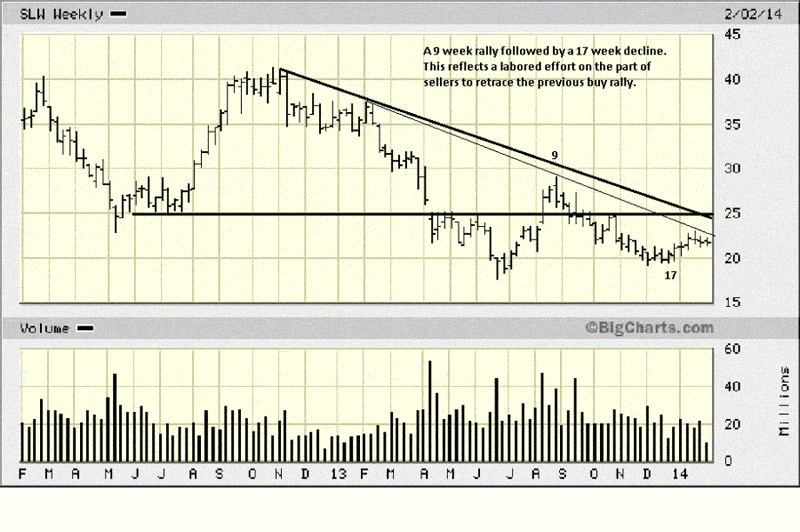
However one wants to view SLW, the performance is slightly weaker to the metal itself. It is a positive that the last sell-off has taken 17 weeks to retrace the prior 9 week rally. The last 4 weeks on the chart show a clustering of closes. A clustering denotes balance between the efforts of buyers and sellers. From balance comes unbalance. A look at the daily chart may give a hint as to which way the unbalance will go.
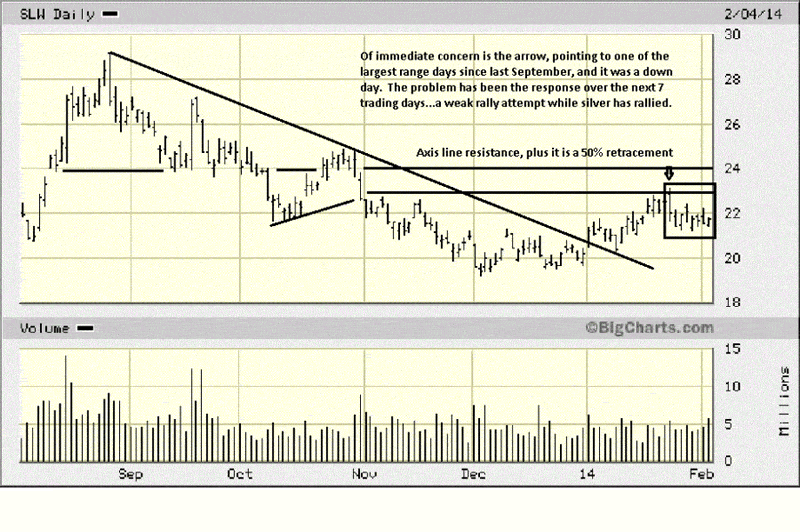
It seemed a little more positive on the weekly as the daily chart shows issues for buyers to overcome more than for sellers. The arrow points to an ease of movement lower, 8 TDs ago, [Trading Days]. Buyers have not been able to regain ground lost in a single day over the next 7 TDs of effort.
The position of price, under a 50% retracement, is relatively weak. It does not mean that buyers cannot overcome resistance, but they have to put in a better show, now.
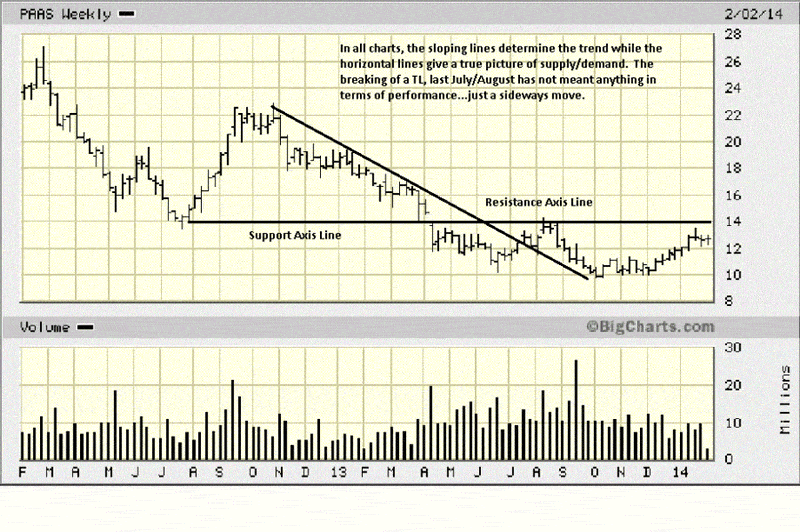
We do not show the 50% retracement area for PAAS, but it is apparent from the eye that price is not even close. The gauging of how price is, using a 50% mark, is a general guide that demonstrates overall weakness, being unable to rally to that level, or strength, when price can rally to, and even exceed a half-way retracement.
The sloping down trend line was broken, last July, but the breaking of a trend line is much less significant than overcoming a horizontal resistance supply line; the one at $14. The designation of an “Axis Line” is one where previous price support has now become one of resistance.
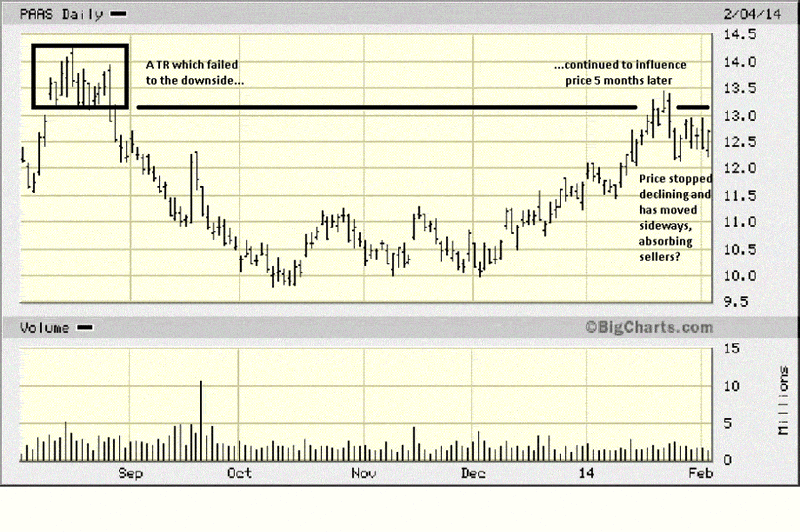
Here, you can see the validity of horizontal lines being significantly more important. The TR, [Trading Range], from last August led to a decline, so expect it to act as resistance whenever price rallies back to it. That rally occurred in January, and price encountered selling because those sellers who went short, last August, are defending their territory, as it were.
What is positive about where PAAS met resistance, currently, is that price has not sold off as it did last August. It appears buyers are meeting the effort from sellers and preventing the market from going lower. Sellers have the edge, based solely on overall market conditions, so it is up to buyers to overcome sellers to gain control.
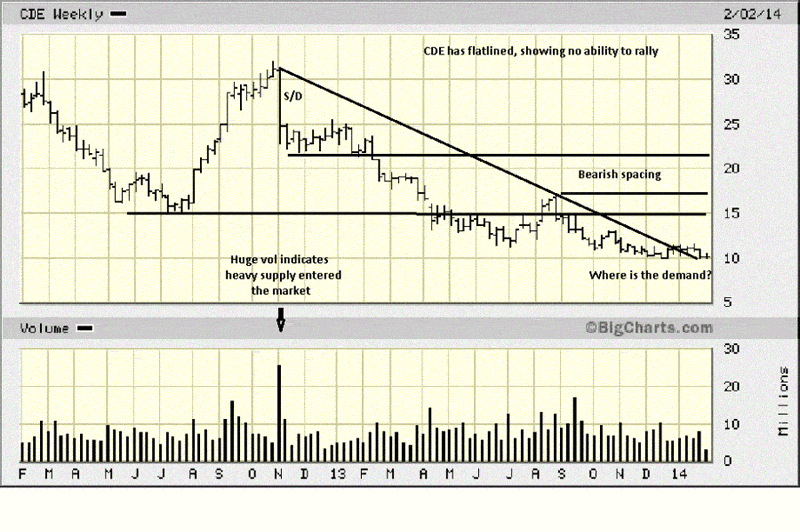
On the scale of relative strength or weakness, PAAS, for example, is stronger than CDE. Given a choice between the two, PAAS should be bought over CDE. Compare where PAAS is trading over the last several weeks, relative to where CDE is trading, and the concept of relative strength becomes very clear.
Bearish spacing occurs when the last swing rally high is under the last swing rally low, and the two horizontal lines, one above 20, the last swing low from the end of 2012, and the line above 15, showing the last swing high. Whenever there is a space, it indicates a much weaker market because sellers did not need to wait and see how the last swing low would be tested. They were aggressively selling into the rally above 15, leaving the telltale space.
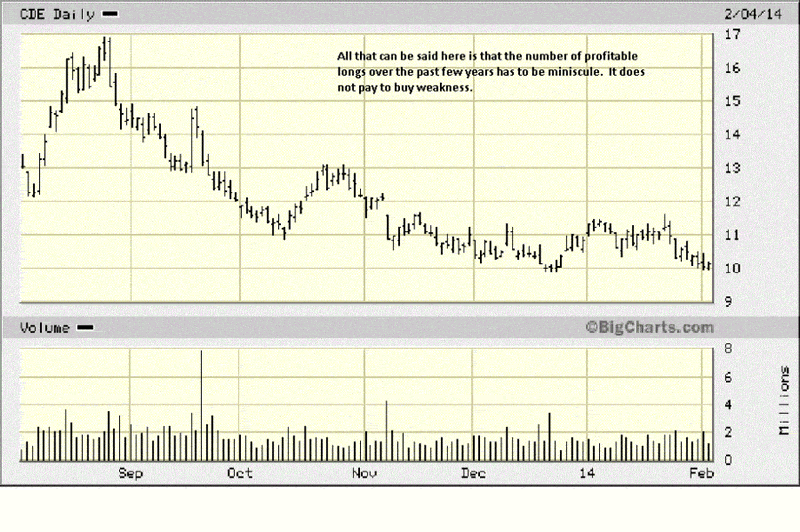
The negative read on the weekly is amplified by the closer detail on the daily chart. It speaks for itself.
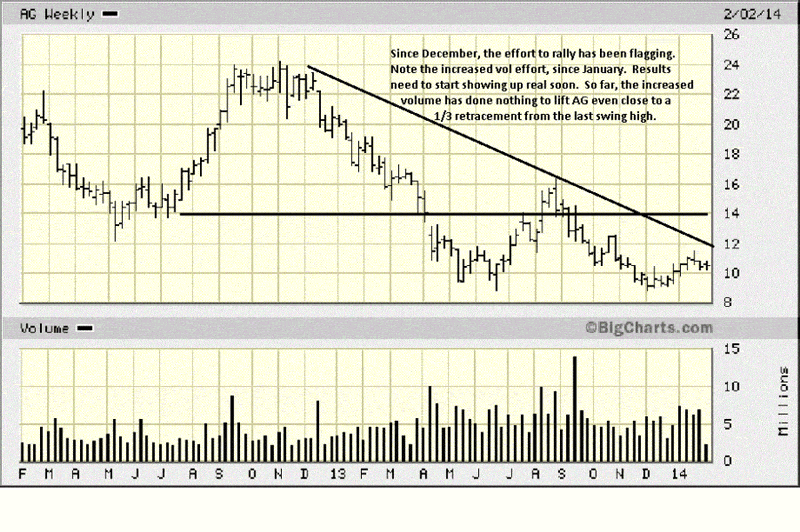
The chart comments need not be repeated. AG is laboring. The inability to rally even above a 1/3 retracement speaks to the general weakness of this stock. Mention was made from the outset that reading a chart cuts through all other considerations, particularly fundamental ones, and gives a clearer picture of how a company is faring on its own, and more importantly, relative to other companies in the same sector.
Where are the buyers?
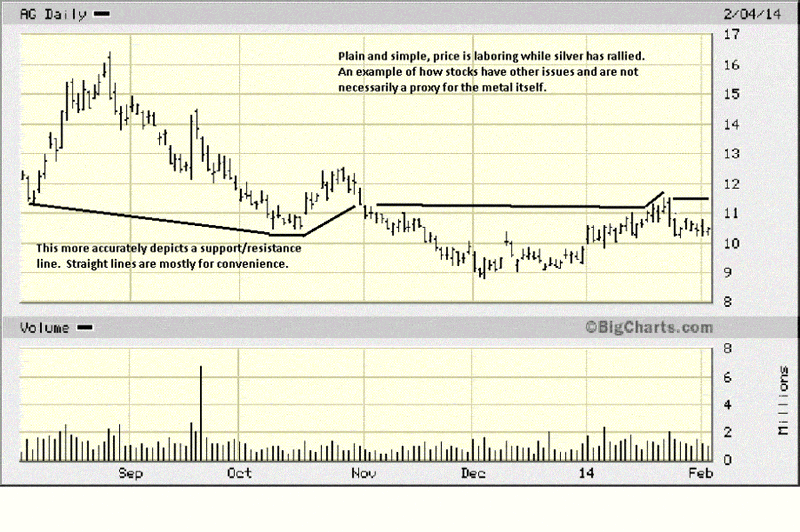
The swing highs and swing lows were connected to give a slightly different way of looking at how a stock is performing.
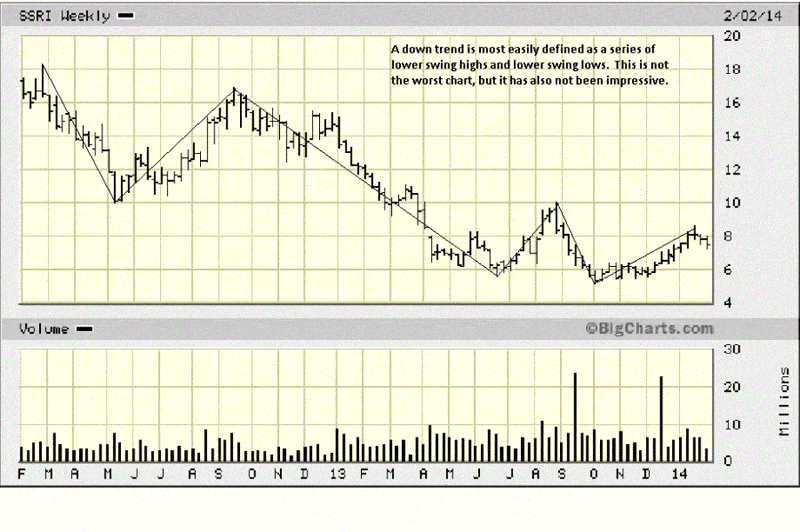
Where the weekly SLW seemed that it would lead to a more positive look on the daily chart, which the daily failed to do, SSRI has a more positive look on the daily than one might have expected from viewing the weekly.
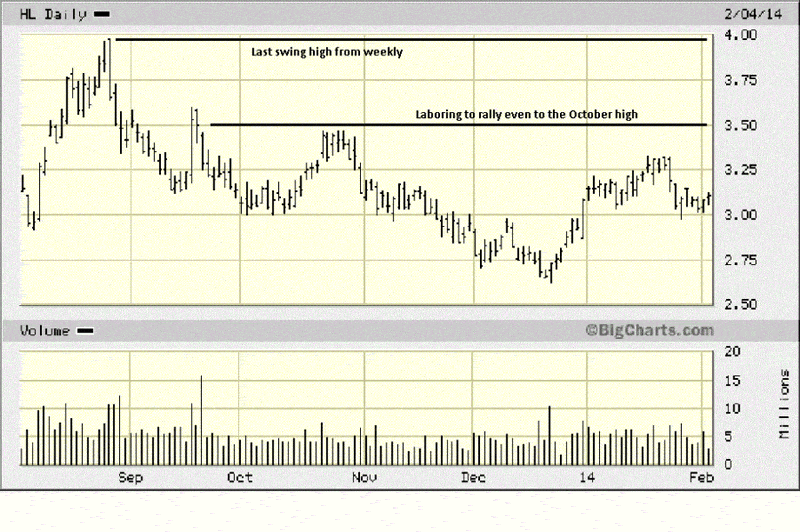
There is still some work to do for buyers to overcome sellers, but the direction of price, since the last swing low, is at least pointing upwards. How SSRI is able to recover from the recent sell-off, or not, will give an important clue in what to expect, moving forward.
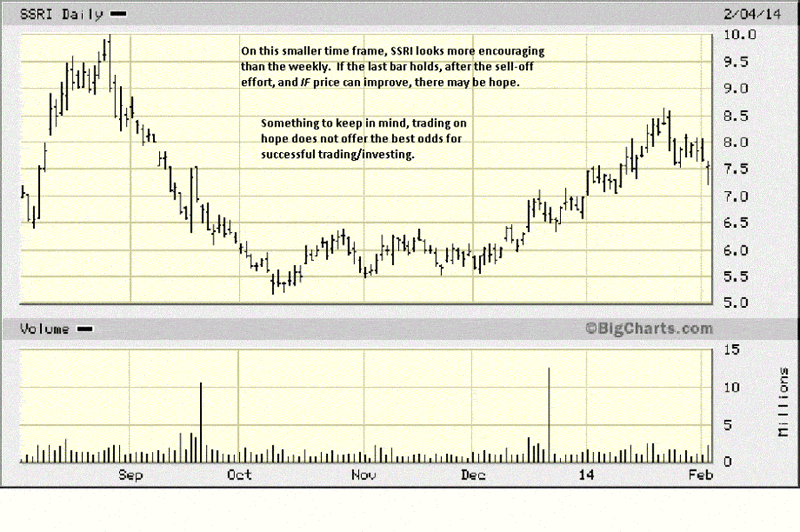
Look at where price is, relative to resistance at the $4 level. This is another relatively weak performer and one that should raise questions as to why it should be bought, or even held.

The takeaway from this exercise is to 1. demonstrate the importance of the ability to read a chart, based solely on price and volume activity. Note that no reference was made to any mechanical technical tools, like RSI, Moving Averages, etc. They are not accurate as to timing, and if not, why bother with them? 2. The importance of relative strength when assessing whether to buy one stock over another within the same sector, or even buying in one sector relative to another one that is clearly performing better.
The objective is to be profitable, and the above analysis has provided examples of how one goes about improving one’s effort in attaining that objective.
By Michael Noonan
Michael Noonan, mn@edgetraderplus.com, is a Chicago-based trader with over 30 years in the business. His sole approach to analysis is derived from developing market pattern behavior, found in the form of Price, Volume, and Time, and it is generated from the best source possible, the market itself.
© 2013 Copyright Michael Noonan - All Rights Reserved Disclaimer: The above is a matter of opinion provided for general information purposes only and is not intended as investment advice. Information and analysis above are derived from sources and utilising methods believed to be reliable, but we cannot accept responsibility for any losses you may incur as a result of this analysis. Individuals should consult with their personal financial advisors.
Michael Noonan Archive |
© 2005-2022 http://www.MarketOracle.co.uk - The Market Oracle is a FREE Daily Financial Markets Analysis & Forecasting online publication.


