US Economic Quarterly Review and Outlook for 2008
Economics / US Economy Apr 22, 2008 - 01:50 AM GMTBy: John_Mauldin

 This week's Outside the Box is from my friends at Hoisington Management. While somewhat technical, they make the case that a slowdown in consumer spending is inevitable. This is worth taking some time and thinking about. Quoting: "This means that consumer spending increases should be approximately zero for the next three years. Further exacerbating the problem is the personal saving rate which declined from 5.2% in the decade of the 1990s to average 1.3% in the last seven years, and now stands at 0.3%. Should declining wealth, rising unemployment and poor economic conditions cause consumers to begin to save and lift the rate back to the 1.3% average of the past seven years, real consumer spending would experience a multi-year contraction."
If they are right, and the evidence of their research is compelling, then we are in for a much tougher time than the recent stock market rallies suggest. The stock market is not always a leading indicator. This week's letter suggests that businesses that depend on the US consumer for growth may be in trouble.
John Mauldin, Editor
Outside the Box
Quarterly Review and Outlook - First Quarter 2008
From Hoisington Management Semantics
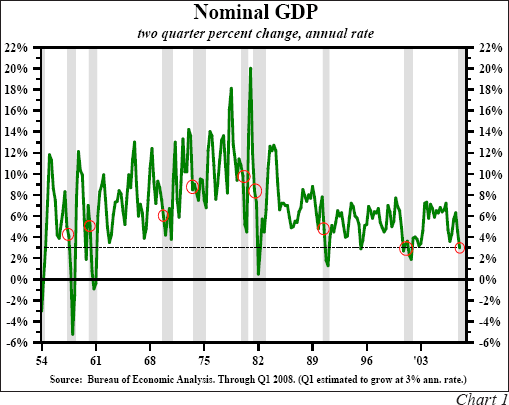
Nominal GDP in the first quarter totaled an estimated $14.2 trillion, a 3% annual rate of increase from the final quarter of 2007, which also registered a 3% gain. This two quarter growth rate in nominal GDP is typically associated with recessionary periods (Chart 1). The various price deflators applied to this nominal gain will now determine whether real GDP will be negative or positive, possibly clarifying the debate of whether an actual recession is in place. For financial participants, however, this argument is moot since the U.S. economy, at best, has been in a growth recession since mid-2007.
Solomon Fabricant, the NYU professor and NBER committee member who first identified this particular characteristic of the business cycle, stated that a growth recession occurs when economic conditions are sufficiently poor that unemployment rises and industrial capacity falls. From the cyclical low in March 2007 to March 2008, the unemployment rate jumped from 4.4% to 5.1%. In February, the manufacturing capacity use rate was 78.7, down 1.4% from its peak in July. Both signify a deteriorating economy. Growth recessions, like full scale recessions, produce falling inflation, a margin squeeze on corporate profits, eroding stock prices, and declining interest rates. Thus, the difference is really one of semantics. The point for investors is not what type of recession we are experiencing, but rather how long the downturn will last. Our conclusion is that our present economic difficulties will persist for at least two years.
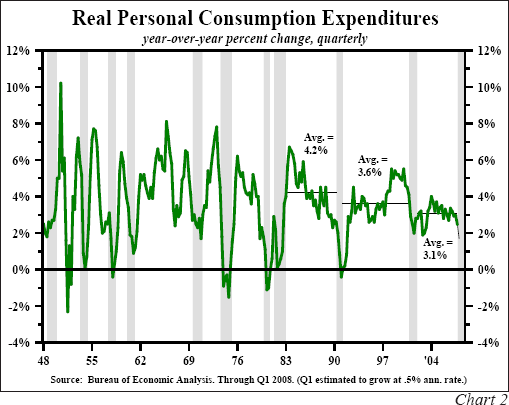
An Extended SlumpGoing forward, the main problem for the U.S. economy is likely to be a protracted period of restrained consumer spending. In the expansion from 2002 to 2007, real Personal Consumer Expenditures (PCE), which comprised 71.5% of GDP at the end of last year, posted a 3.1% per annum increase, down from 3.5% and 4.2%, respectively, in the expansions of the 1990s and 1980s (Chart 2). The subdued gain in spending would have been even less had consumers lived within their means, as real personal income (2.5%) expanded less than the spending rate. With spending outpacing income, the personal saving rate dropped from 2.4% in 2002 to 0.4% in 2007.
A disparity of 0.7% per annum between the growth of income and spending might seem insignificant until you consider that income must also support all the other demands on consumers -- investment in housing and other real assets, financial investment, and gifts to charitable and other causes.
The main cause of the weaker trend in personal income in this decade was lackluster real wage and salary income that rose just 1.8%, or one-half the rate of gain in the expansion of the 1990s. This meager gain was caused by the sluggish .8% payroll employment growth rate that was the smallest of any expansion since World War II. With this key determinant of consumer spending restrained, consumers lived well beyond their means, only because their paper worth was boosted by surging home prices.
Consumption And The Wealth EffectOne of the most studied issues is the consumption function - the factors that determine the way in which consumers are motivated to spend. For example, in Macroeconomics by Andrew Abel of Wharton and Ben Bernanke (now of the Federal Reserve and formerly of Princeton University) have a lengthy section entitled "the effects of changes in income and wealth on consumption and saving". This analysis like many others of a similar nature conclude that both income, expected future income, wealth as well as other considerations are causally related to spending. Using econometric models, economists are able to assign different numeric weights to those elements in the consumption function. These studies indicate, as a general rule, that expected or permanent income is more important that current income and that income considerations are more important than wealth. However, something known as initial conditions (the current starting point in the business cycle) may serve to over-ride the general rule. We, for example, believe that there are notable difficulties facing the U.S. economy that were typically not present in the past.
Wages, salaries, interest, dividends and rent generate funds that are available for spending. When wealth rises, however, funds are not typically generated that, in turn, can be translated into spending. Thus, understanding the mechanism of how wealth translates into spending may involve additional steps.
Consumers could turn wealth into spending funds by selling appreciating assets. However, if all consumers decided to do this at roughly the same time, the prices of those assets would fall, reversing the rise in wealth that had seemingly occurred. Thus, the main mechanism that increased wealth leads to rising consumption is for consumers to borrow against those assets. This, therefore, avoids the necessity of selling the appreciating asset and avoiding or at least postponing the decline of the appreciating assets.
Our research suggests that the mechanism of choice from 2002 to 2007 to convert rising wealth into spendable funds was borrowing against what consumers and their lenders apparently believed to be was a permanent rise in housing wealth - i.e. something that we have come to know as equity cash take outs.
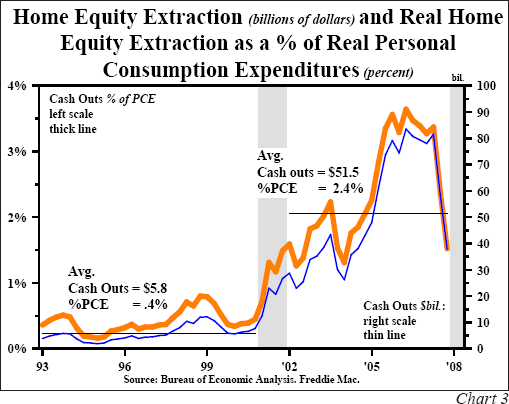
The Home Equity ConnectionFrom 2002 to 2007, home equity extraction, as determined by Freddie Mac, averaged $51.5 billion per quarter, up from $5.8 billion in the 1990s expansion (Chart 3). If we convert these cash outs into real dollars (using the PCE deflator), we see that they represented 2.4% of real PCE from 2002 to 2007, compared with a miniscule .4% of PCE in the 1990s. Thus, for spending, the shortfall in jobs and income was substituted by the famous home ATM machine. However, the connection between equity withdrawal and wealth is a complex matter. A great deal of econometric research has demonstrated that for every dollar change in real wealth, real spending shifts by 7.5 cents over the ensuing three years. If the massive real wealth gains derived from both homes and the equity markets in the 2002 to 2007 period are adjusted by the $1 to 7.5 cent relationship, the real wealth gains amounted to 2.5% per annum, expressed as a percent of real PCE. For all practical purposes, this is equal to the 2.4% per annum rise in mortgage cash outs. Consumers borrowed against the value of their homes in virtual direct proportion to their wealth gains.
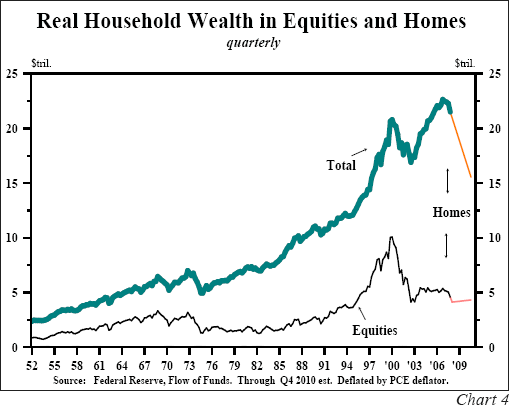
The problem going forward is that real wealth is now declining, with the bottom yet to be found. Assuming home prices fall only 30% from their peak (some estimate a 50% decline), while stock prices rise 10% from the first quarter level and inflation is 2% per annum, the real wealth loss is about $7 trillion (Chart 4). Using the $1 to 7.5 cent ratio, this will constitute a drag on real PCE of 1.8% per annum from 2008 to 2010. Considering that the 3.1% rate of increase was the last expansion's average, a 1.8% drag will be a 60% reduction in consumer spending growth over the next three years just from the cash out/wealth effect alone.
However, there are other constraints. During the postwar recessions, real personal income's average growth was only 1.9%, but it has risen only 1.1% over the past 12 months. If real personal income moves back up to 1.9%, in itself a highly optimistic assumption, it would, nevertheless, be completely offset by the negative wealth impact of 1.8% mentioned above. This means that consumer spending increases should be approximately zero for the next three years. Further exacerbating the problem is the personal saving rate which declined from 5.2% in the decade of the 1990s to average 1.3% in the last seven years, and now stands at 0.3%. Should declining wealth, rising unemployment and poor economic conditions cause consumers to begin to save and lift the rate back to the 1.3% average of the past seven years, real consumer spending would experience a multi-year contraction. It is not a stretch to predict an extended quasi-recessionary period.
Is Inflation Accelerating?In the last twelve months, the CPI increased by 4.1%, well above the 2.8% average annual increase this decade. Do these readings mean that the inflationary spiral has started? Other factors that contribute to inflation fears are the acceleration in M2 growth to a 13% rate of increase in the past three months, $100 plus per barrel oil, elevated prices for food, a wide variety of other commodity prices, and a weak dollar. A related question is whether the higher CPI readings, combined with poor economic growth, will result in stagflation, a condition last witnessed nearly three decades ago. Four considerations suggest that these fears are not likely to be realized.
First, inflation is a lagging indicator. This is true of all major broad based inflation barometers -- the CPI, the core CPI, the more reliable core PCE deflator and the Employment Cost Index (ECI). Over the past five cyclical downturns, the year over year increases in these four series did not peak until the economy was in recession (Chart 5). In all these situations, major reductions in inflation occurred in the early stages of the ensuing recovery. This historical pattern is due to the fact that productivity surges rapidly in early stage expansion, causing unit labor costs to rise much more slowly than wage costs.
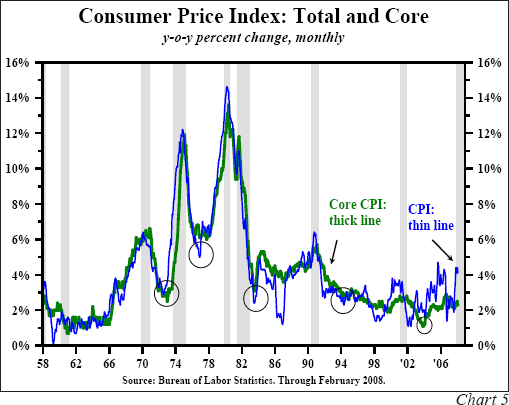
Second, in this particular episode all these inflation gauges have peaked well before the start of the growth recession in mid-2007. The year over year increases peaked as follows: 4.7% for the headline CPI in September 2005; 2.9% for the core CPI in September 2006; 2.5% for the core PCE in February 2007, and 4% for the ECI all the way back in the fourth quarter of 2003. The year over year change in the fourth quarter was a substantially lower 3%.
Third, the unprecedented deceleration in the increase in the ECI of one full percent during the past three years of economic expansion strongly documents the impact of globalization on the United States inflation rate. Even with the recent increases, the unemployment rate is still 1.2% lower than in June 2003. Despite this tighter job market, wage cost increases decelerated, a clear reflection that employers have global options, and wages are increasingly set in the global marketplace. This is strong confirmation that the upturn in headline inflation is transitory. Higher food and fuel costs have not fed into wages, a critical element since wage, salary and benefit costs comprise almost 70% of the cost of production in the United States. Persistent inflation episodes have all exhibited a price/wage spiral.
Fourth, in spite of the 13% rate of growth in M2 in the past three months, and the striking new creations in Federal Reserve lending and financial support activities, we actually judge the thrust of monetary polity to be somewhat restrictive, not expansionary. This is based on the consideration of both the stock of money (M) and its velocity (V). For example, the first quarter surge in M2 growth has been more than entirely neutralized by a dramatic decline in M2 velocity (Chart 6).
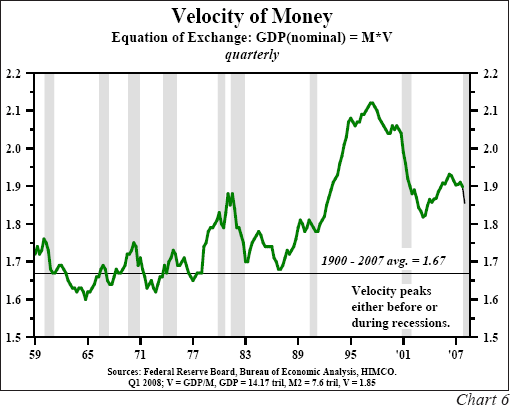
Moreover, velocity is likely to continue to decline. Velocity falls when financial innovations are not forthcoming and declines sharply when previous financial innovations are reversed. In the midst of the current massive credit crunch, this cycle's innovations in mortgage finance, collateralized debt obligations, and structured investment vehicles are all being reversed. In the first quarter, nominal GDP grew around a 3% annual rate, meaning that velocity dropped to 1.85 from 1.9 in the fourth quarter, remaining well above the post 1900 average of 1.67.
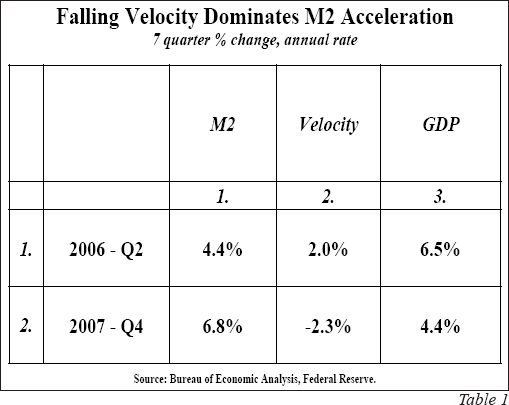
More striking, perhaps, has been the impact of velocity over the past seven quarters. M2 growth has accelerated to 6.8% versus 4.4% in the seven quarters ended in the second quarter of 2006 when velocity peaked. Based on M2 alone, the economy should have been accelerating, not falling into the current slump. However, in the past seven quarters V2 (the velocity of M2) declined 2.3% per annum, causing GDP growth to decelerate from 6.5% to 4.4% (Table 1). This declining velocity will mean the Federal Reserve's best efforts are likely to be thwarted, and nominal GDP will slow coincident with inflation and output.
Treasury yields have dropped to near record lows, but the historical record suggests the ultimate bottom in cyclical rates is considerably in the future. On average, thirty year Treasury bond yields are a lagging economic indicator. This is not surprising since inflation is a lagging indicator and inflation is the main long run determinant of bond yields. Since the end of World War II, the thirty year Treasury yields reached their cyclical lows, on average, 14.9 months after the end of the business cycle troughs (Table 2).
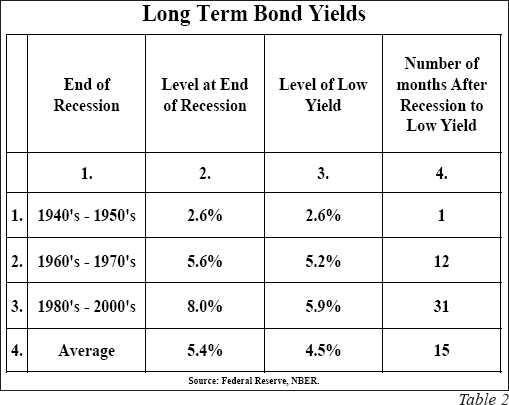
Thus, if this growth, or outright recession, ends in 2008, the low in bond yields will be some time in 2010. However, if we are in an extended growth recession that lasts into 2009 or 2010, as we suspect, and if rates are at record low levels, similar to the 1940s and 1950s, then the low in rates is likely to coincide with the end of the recessionary period.
Van R. Hoisington
Lacy H. Hunt, Ph.D.
Your doing my bit to keep up consumer spending analyst,
By John Mauldin
John Mauldin, Best-Selling author and recognized financial expert, is also editor of the free Thoughts From the Frontline that goes to over 1 million readers each week. For more information on John or his FREE weekly economic letter go to: http://www.frontlinethoughts.com/learnmore
To subscribe to John Mauldin's E-Letter please click here:http://www.frontlinethoughts.com/subscribe.asp
Copyright 2008 John Mauldin. All Rights Reserved
John Mauldin is president of Millennium Wave Advisors, LLC, a registered investment advisor. All material presented herein is believed to be reliable but we cannot attest to its accuracy. Investment recommendations may change and readers are urged to check with their investment counselors before making any investment decisions. Opinions expressed in these reports may change without prior notice. John Mauldin and/or the staff at Millennium Wave Advisors, LLC may or may not have investments in any funds cited above. Mauldin can be reached at 800-829-7273.
Disclaimer PAST RESULTS ARE NOT INDICATIVE OF FUTURE RESULTS. THERE IS RISK OF LOSS AS WELL AS THE OPPORTUNITY FOR GAIN WHEN INVESTING IN MANAGED FUNDS. WHEN CONSIDERING ALTERNATIVE INVESTMENTS, INCLUDING HEDGE FUNDS, YOU SHOULD CONSIDER VARIOUS RISKS INCLUDING THE FACT THAT SOME PRODUCTS: OFTEN ENGAGE IN LEVERAGING AND OTHER SPECULATIVE INVESTMENT PRACTICES THAT MAY INCREASE THE RISK OF INVESTMENT LOSS, CAN BE ILLIQUID, ARE NOT REQUIRED TO PROVIDE PERIODIC PRICING OR VALUATION INFORMATION TO INVESTORS, MAY INVOLVE COMPLEX TAX STRUCTURES AND DELAYS IN DISTRIBUTING IMPORTANT TAX INFORMATION, ARE NOT SUBJECT TO THE SAME REGULATORY REQUIREMENTS AS MUTUAL FUNDS, OFTEN CHARGE HIGH FEES, AND IN MANY CASES THE UNDERLYING INVESTMENTS ARE NOT TRANSPARENT AND ARE KNOWN ONLY TO THE INVESTMENT MANAGER.
John Mauldin Archive |
© 2005-2022 http://www.MarketOracle.co.uk - The Market Oracle is a FREE Daily Financial Markets Analysis & Forecasting online publication.


