What Does It Take to Be in the Top 1 Percent? Not As Much As You Think
Politics / Taxes Jan 21, 2014 - 06:17 PM GMTBy: Frank_Holmes
 When you think of the top 1 percent of all income earners in American households, how much do you think this group rakes in? Millions? Tens of millions? What about the top 10 percent or even top 20 percent?
You might be surprised to learn that the top 20 percent of income earners bring in a household income of just over $100,000. The top 10 percent of earners have a household income of more than $148,687. To be considered in the top 1 percent, household income is at least $521,411.
My friend Alexander Green of The Oxford Club brings these figures to his readers’ attention in “How to Know if You’re Rich.” I’ve known Alex for years. He is a great source of inspiration for me and for many investors with his uplifting, holistic articles that relate to both health and wealth. If you aren’t already a fan, I encourage you to check out his prolific writings at oxfordclub.com.
Earning enough income to be in the top 1, 10 or 20 percent is no small accomplishment, but chances are good that many people you know, and may not think of as rich, fall into the top 1, 10 or 20 percent.
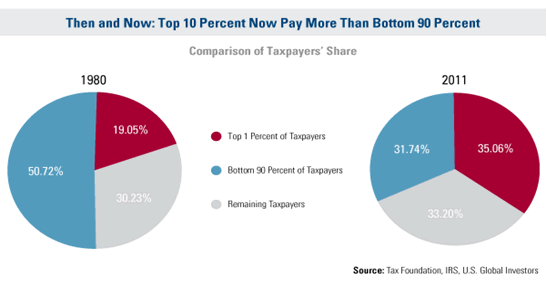
Contrast these income statistics with the picture often painted in the media that the wealthiest Americans aren’t paying their fair share. According to the Tax Foundation, the top 1 percent of households collectively pay more in taxes than all of the tax-paying households in the bottom 90 percent.
Take a look at how much this has changed over the past few decades. In 1980, the bottom 90 percent of taxpayers paid about half of the taxes. The top 1 percent contributed about 20 percent.
Now, the top 1 percent pays more than the bottom 90 percent. Perhaps this is more than their fair share?

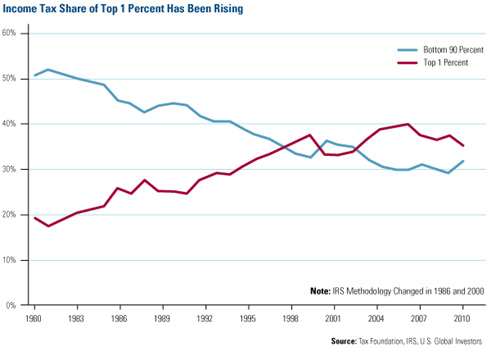
Here’s the line chart from the Tax Foundation showing how the income tax share for each category has changed since 1980. For the majority of years, the share of the bottom 90 percent fell while the share of the top 1 percent rose.

Even though many of today’s tax policies punish the top-earning households, there are still tax advantages for hard-working Americans who make saving and investing a priority in their lives.
A great new year’s resolution is to make sure less of your money is going to the government and more money is working for you in your investments. One way to keep this resolution is to maximize your contributions to tax-advantaged investment vehicles such as an individual retirement plans, a 401(k) or SEP for the self-employed, all of which offer tremendous tax benefits.
You may be surprised to see how annual deferral limits have increased over the past few years. Take a look at our new 2014 tax rate guide, which is a great resource giving you a quick look at tax brackets, deferral limits for retirement plans, and alternative minimum tax exemptions.
To make it easier to have the discipline to set money aside, try an automatic plan that invests a fixed amount at regular intervals, such as U.S. Global Investors’ ABC Investment Plan.
No matter how much you earn, wealth is determined by how much you keep. Alex says wealth isn’t necessarily determined by an income figure. Instead, real wealth is determined by looking at your balance sheet. Here’s his formula:
“Maximize your income (by upgrading your education or job skills). Minimize your outgo (by living beneath your means). Religiously save the difference. (Easier said than done.) And follow proven investment principles.”
What matters most is being grateful for what you have. I’m a big believer that wealth is not a number or an amount, it’s an attitude and the umbilical cord to attitude is gratitude.
Want to receive more commentaries like this one? Sign up to receive email updates from Frank Holmes and the rest of the U.S. Global Investors team, follow us on Twitter or like us on Facebook.
By Frank Holmes
CEO and Chief Investment Officer
U.S. Global Investors
U.S. Global Investors, Inc. is an investment management firm specializing in gold, natural resources, emerging markets and global infrastructure opportunities around the world. The company, headquartered in San Antonio, Texas, manages 13 no-load mutual funds in the U.S. Global Investors fund family, as well as funds for international clients.
All opinions expressed and data provided are subject to change without notice. Some of these opinions may not be appropriate to every investor.Standard deviation is a measure of the dispersion of a set of data from its mean. The more spread apart the data, the higher the deviation. Standard deviation is also known as historical volatility. All opinions expressed and data provided are subject to change without notice. Some of these opinions may not be appropriate to every investor. The S&P 500 Stock Index is a widely recognized capitalization-weighted index of 500 common stock prices in U.S. companies. The NYSE Arca Gold BUGS (Basket of Unhedged Gold Stocks) Index (HUI) is a modified equal dollar weighted index of companies involved in gold mining. The HUI Index was designed to provide significant exposure to near term movements in gold prices by including companies that do not hedge their gold production beyond 1.5 years. The MSCI Emerging Markets Index is a free float-adjusted market capitalization index that is designed to measure equity market performance in the global emerging markets. The U.S. Trade Weighted Dollar Index provides a general indication of the international value of the U.S. dollar.
Frank Holmes Archive |
© 2005-2022 http://www.MarketOracle.co.uk - The Market Oracle is a FREE Daily Financial Markets Analysis & Forecasting online publication.


