Gold Outlook for 2014
Commodities / Gold and Silver 2014 Jan 17, 2014 - 05:47 PM GMTBy: James_Turk
 Before looking at the year ahead, it is useful to look back at the year just passed. This adage is particularly true now because little has changed. Three major markets - stocks, bonds and gold - will again be driven this year by the same forces that shaped 2013, but the outcome will be different in one key respect. This year the price of gold will rise.
In January 2013, my outlook for the year ahead focused on three specific events. These were a rising yield on the 10-year Treasury note, growth of the Federal Reserve's balance sheet, and a decline in the gold/silver ratio.
Two of these events unfolded as expected. But the third did not confirm the other two.
1) Yields on the 10-year Treasury note rise
Back in January 2013, I considered the 2% yield on the 10-year T-note to be crucial. I saw it as an important tipping point, which when breached would signal that financial repression by the Federal Reserve was ending. I expected that when this 2% yield was eventually hurdled, it would be a key indicator telling us that the Fed could not keep interest rates at artificially low levels any longer because market forces had begun to overpower the Fed. In other words, the tipping point would occur when investors were selling more Treasury debt instruments than the Fed was buying, and this imbalance would result in higher yields.
Yields bumped up against the 2% level several times in the first few months of 2013. Eventually 2% gave way in May 2013 as the Fed prepared for that month's FOMC meeting. The market believed there was a good possibility the Fed would announce that it was cutting back on its quantitative easing program. When that did not happen, yields surged and hurdled above another key technical level, 2.3%. Importantly, the yield on the 10-year T-note now appears ready to break above a third critical level, 3%, which ties into the next point.
2) Growth in the Federal Reserve's balance sheet
The Federal Reserve began expanding its balance sheet almost immediately after the collapse of Lehman Brothers in September 2008, as it sought to protect banks in the resulting financial crisis that thoroughly routed global markets. Through its quantitative easing program as well as currency swaps it was conducting with European banks, the Fed's total assets rose to a peak of $2.86 trillion in July 2011.
The Fed then put on the brakes, so that eighteen months later its total assets had actually dropped slightly to $2.81 trillion. It was this unexpected throttling of its asset growth that had me pondering in January 2013.
When the Fed increases its assets, it turns debt into US dollar currency. But in contrast to prevailing economic and monetary theory as well as conventional wisdom, the newly created currency the Fed was pumping out was doing little for the US economy. Unemployment remained stubbornly high, even with the government's massaging of the numbers. Real personal income and retail sales (excluding high-end sales to the rich) were stagnant, and the customary feel-good factor prevalent in economic expansions was totally absent.
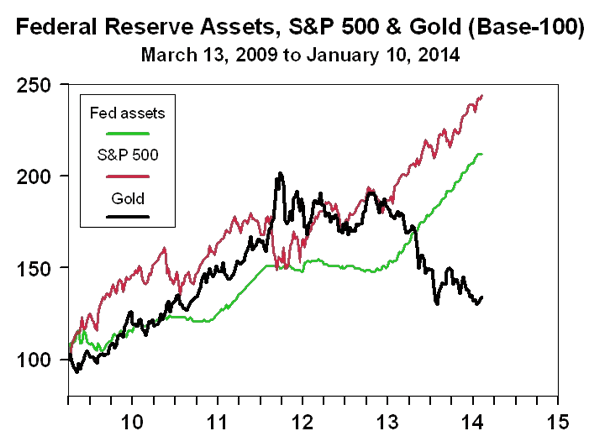
The newly created currency was, however, doing wonders for the stock market and gold as we can see in the following chart, which clearly illustrates their correlation. From the Fed's announcement in March 2009 that it would be undertaking $1 trillion of quantitative easing, both were lifted by this monetary largesse, with gold and the Fed's total assets actually reaching a new record in 2011. But advances in gold and the S&P stalled when the Fed stopped expanding its balance sheet.

Taken together, these events meant that stocks had not risen from their post-Lehman low because of good economic conditions. Rather, all the new money the Fed was creating had to go somewhere, and it ended up in the stock market. It also of course ended up in gold, which always responds with higher prices when the Fed debases the dollar by creating too many of them.
So while the advance in stocks and gold stopped, I expected the gold price to rise in 2013 because it seemed highly likely that the Fed would again be expanding its balance sheet with more debt monetization. Turning debt into currency is central banks' only tool. And they use this tool time and again to paper over financial problems and insolvent banks as well as to try jumpstarting the economy, even though they are already debt-laden.
Central banks also use debt monetization to hide the insolvency of governments, which borrow more money than the market is willing to lend to them. When faced with the inability to foist its debt instruments on the public, governments do not cut back their spending plan. Rather, they force central banks to buy the government debt and turn it into currency. This path to currency destruction leads to a flight from the country's currency into real goods, and if not stopped in its tracks by returning to sound money principles, destroys the currency with hyperinflation.
While this outcome for the dollar and a higher gold price seem clear to me, timing is always problematic. So last January I recommended watching one more indicator to confirm my analysis.
3) The gold/silver ratio falls below 50
During precious metal bull markets, silver outperforms, meaning the gold/silver ratio falls. As the price of both precious metals rise, the price of silver rises faster so that it takes fewer and fewer ounces of silver to exchange for one ounce of gold.
The reverse happens when the precious metals are in a bear market, whether long-term or just a short-term corrective phase within a long-term bull market (which describes the current state of the precious metals). Silver underperforms gold. The price of silver - when measured in percentage terms - falls more than the price of gold.
So I recommended watching the gold/silver ratio in 2013 to see if it fell below 50, which was an important technical level. It remains an important technical level because the ratio has not yet been breached. When it is, this event will signal that silver is outperforming gold, indicating that both gold and silver are moving higher, but with silver rising faster than gold.
Having established this background information, let's turn now to the year ahead. Interestingly, the next twelve months will depend on the same three forces - interest rates, the Federal Reserve's balance sheet and the gold/silver ratio confirming whether the precious metals are finally ready to turn higher. This last point is important.
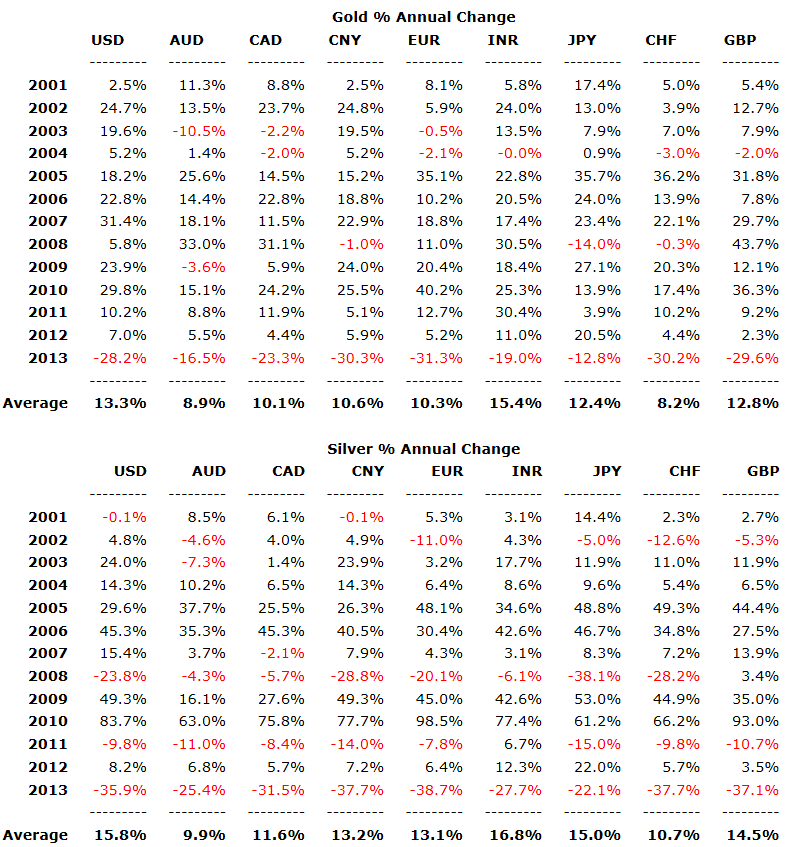
For decades the Federal Reserve's monetary policies and the US government's fiscal policies have been destroying the purchasing power of the dollar. The following tables illustrate this ongoing erosion of the dollar's purchasing power. They also show a similar result for all the world's major currencies because governments and central banks throughout the globe are following harmful monetary and reckless fiscal policies. In contrast to the 1970s when the German mark and Swiss franc offered refuge from a dollar that was being rapidly inflated, no national currency today offers a safe haven.

For the past thirteen years, gold and silver have achieved exceptional annual rates of appreciation on average, even with gold's decline in 2013. This performance ranks gold and silver among the best performing asset classes.
As for the future, gold and silver will continue to rise as long as the same policies in Washington are followed. Given that the federal government is still spending and spending and the Federal Reserve is still printing and printing (even if it actually does taper this month by dropping its debt monetization by $10 billion a month to $75 billion), the precious metals will over time move higher.
I expect that higher gold and silver prices will be the major difference between 2013 and 2014. Accumulating physical gold and/or physical silver on a cost-averaging basis remains an important strategy for 2014. By doing so you are saving real money, and savings are always important, as I explain in an article entitled "Saving Real Money". http://www.goldmoney.com/research/research-archive/saving-real-money
Many years ago prominent newsletter writer Richard Russell coined the phrase 'inflate or die' to explain the Fed's predicament. The financial system has become so abnormal, the Fed has to keep inflating to prevent the system from literally going off the rails. But the irony is that eventually the currency collapses as a consequence of accumulated inflation.
This issue is addressed in The Money Bubble: What To Do Before It Pops, a new book I have co-authored with John Rubino. In our 2004 book, The Coming Collapse of the Dollar, John and I advised readers to bet against the housing bubble before it popped and to buy gold before it soared. Those were literally the two best investment ideas of the decade.

We are now saying that history is about to repeat. Instead of addressing the causes of the 2008 financial crisis, the world's governments have continued along the same path, accumulating even more debt and inflating even bigger financial bubbles. Thus, the outlook for 2014 is the same as it was for last year, the important point being the potential for a black-swan event like the one experienced in 2008 with the Lehman Brothers collapse. The reason for this worrying outlook is simple. The interrelated sovereign debt and bank solvency crises have not been resolved, and central banks are following monetary policies that are favorable to governments and banks, not savers and investors.
So the outlook for gold and silver remains very bullish because another - even bigger - crisis is coming. Whether it ends up being called a "crack-up boom" or "the end of paper money" or "the second Great Depression," it will change everything, from the kinds of investments that create new fortunes to the kinds of money that most of us save and spend.
By James Turk
http://goldmoney.com
James Turk is the Founder & Chairman of GoldMoney.com < http://goldmoney.com>.
Copyright © 2014 by James Turk. All rights reserved.
Disclaimer: The above is a matter of opinion and is not intended as investment advice. Information and analysis above are derived from sources and utilizing methods believed reliable, but we cannot accept responsibility for any trading losses you may incur as a result of this analysis. Do your own due diligence.
© 2005-2022 http://www.MarketOracle.co.uk - The Market Oracle is a FREE Daily Financial Markets Analysis & Forecasting online publication.


