


What Stock Sectors Outperform When the U.S. Dollar is Rising?
Stock-Markets / Stock Markets 2014 Jan 16, 2014 - 06:59 AM GMTBy: Donald_W_Dony

 Starting in 2013, markets appear to be moving into a new stage. The U.S. dollar bottomed in 2008 and the S&P 500 emerged from over a decade of consolidation and deep declines. Though the future action of the U.S. index is too early to forecast, there are strong similarities to happened in 1980.
During the 1965-1979 commodity cycle, the S&P 500 consolidated for 14 years. In that time period, materials were generally the strongest performing sectors. The US$ was weak and generally traded flat.
Once the index broke out of the flat trading pattern in 1980, financials, industrials, healthcare and consumer discretionaries were normally the best performing industry groups and commodities became the lowest performing sectors (Chart 1). The dollar gained strength during this period and advanced to a new high.
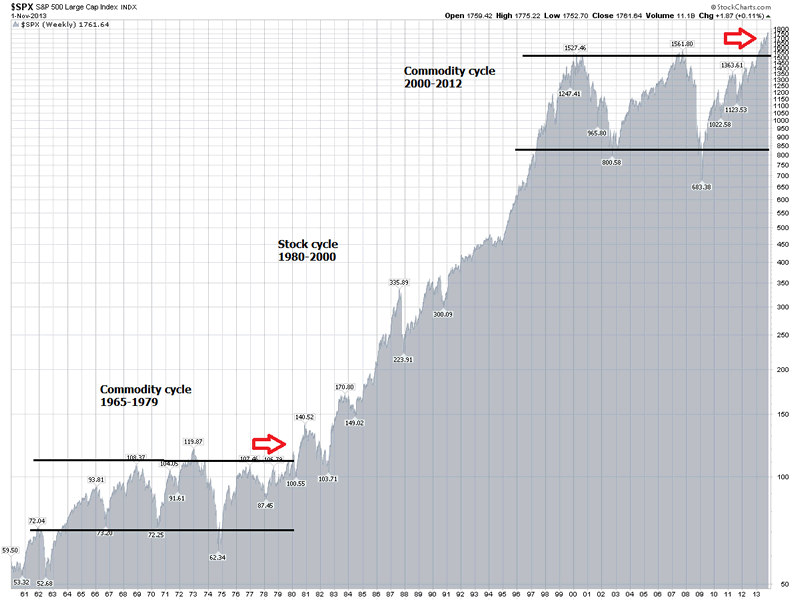
This stock cycle went on for 20 years.
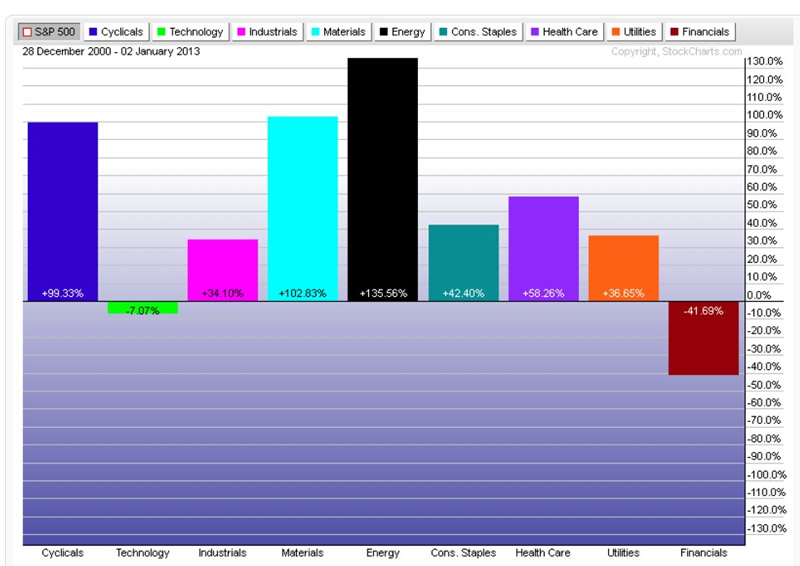
However, beginning in 2000, the commodity cycle returned. The S&P 500 again traded in a deep consolidation pattern and materials once again were the best performing groups. Resource sectors remained the top performing groups throughout the 2000-2012 commodity cycle (Chart 2). The U.S. dollar peaked in 2000 and drifted lower for eight years.
Nevertheless, in 2013, once the S&P 500 again broke out of the secular consolidation formation, the best performing industry groups swung back to the financials, industrials, healthcare and consumer cyclicals (Chart 3).
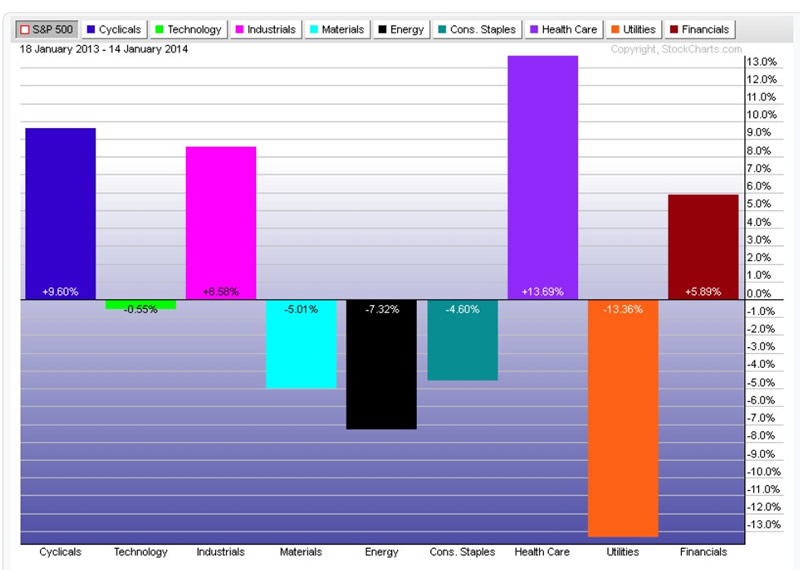
Bottom line: The US$ is once again started to firm and rebound. The current pattern of industry performance resembles the start of the 1980s. Though the length of the present sector dominance is unknown, there is strong evidence from past cycles that the current sector strength will continue over the next few years.
By Donald W. Dony, FCSI, MFTA
www.technicalspeculator.com
COPYRIGHT © 2013 Donald W. Dony
Donald W. Dony, FCSI, MFTA has been in the investment profession for over 20 years, first as a stock broker in the mid 1980's and then as the principal of D. W. Dony and Associates Inc., a financial consulting firm to present. He is the editor and publisher of the Technical Speculator, a monthly international investment newsletter, which specializes in major world equity markets, currencies, bonds and interest rates as well as the precious metals markets.
Donald is also an instructor for the Canadian Securities Institute (CSI). He is often called upon to design technical analysis training programs and to provide teaching to industry professionals on technical analysis at many of Canada's leading brokerage firms. He is a respected specialist in the area of intermarket and cycle analysis and a frequent speaker at investment conferences.
Mr. Dony is a member of the Canadian Society of Technical Analysts (CSTA) and the International Federation of Technical Analysts (IFTA).
Donald W. Dony Archive |
© 2005-2022 http://www.MarketOracle.co.uk - The Market Oracle is a FREE Daily Financial Markets Analysis & Forecasting online publication.