


Best Elliott Wave 2013 Trade Setups to Repeat in 2014
Stock-Markets / Financial Markets 2014 Jan 15, 2014 - 05:58 PM GMTBy: EWI

 We have hand-picked for you seven of the best trade set-ups of 2013 that are bound to be repeated in 2014. Here is one of seven
The best thing about Elliott wave patterns? Easy: They repeat.
They repeat on all timeframes, across dozens of markets, all over the world. Once you know what to look for, you see the familiar 5s and 3s repeat in every chart.
You know what that means? That means that the same trade set-ups the markets gave is 2013 are bound to be repeated in 2014.
We have hand-picked for you seven of the best Elliott wave trade set-ups of 2013. Here is one of seven.
* * *
Market: Gold
Time Frame: Near-Term
Price move: "Crash-like conditions," "panic selling" -- those are just two phrases used to describe the massive sell-off underway in gold since Friday, April 12.
On April 15 gold prices plummeted 10% in their biggest single-day decline in three decades.
April 9 Metals Specialty Service's daily analysis highlighted a "key shelf of support" at 1540-1520. Why? Because it defined the trading range throughout gold's sideways action the prior two years:
"This is very important action. So far, the key shelf of support has held. The quality of the rally that occurs here will tell us whether a major low was registered [last week at 1539], or those shelves will again be tested and perhaps broken. The bearish count would have a large decline unfolding with new lows ... below 1500 a valid possibility."
On April 12 gold prices violated the key shelf of support. The April 12 Metals Specialty Service's daily video update confirmed that the downside floodgates had now been opened:
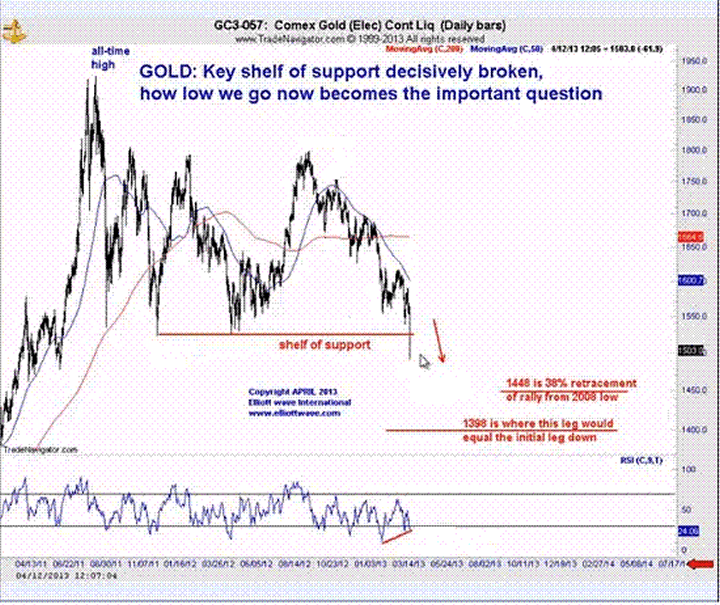
"When you're in this type of extreme environment we're in after you've broken this type of support that's been in effect for a year and a half, that's where you've got to say you could drop another $100-$150 in a matter of days. ...
"Take a step back. We've broken support. We're well below it. It's a key shelf. Unless you rally and close back above this 1520-1535 zone, you've got to be bearish looking for lower prices
"How low? You could go way down ... at least looking for 1448, 1398, perhaps even lower than that."
On April 15, gold followed its near-term bearish Elliott wave script. Prices plummeted below the $1448, then $1398, then "even lower" to 1321 on April 16.
* * *
See the other 6 "best of" trade setups -- including silver, crude oil, and USD/JPY (video) -- now. |
This article was syndicated by Elliott Wave International and was originally published under the headline The Best of 2013: Seven Classic Elliott Wave Trade Setups You'll See Again in 2014. EWI is the world's largest market forecasting firm. Its staff of full-time analysts led by Chartered Market Technician Robert Prechter provides 24-hour-a-day market analysis to institutional and private investors around the world.
About the Publisher, Elliott Wave International
Founded in 1979 by Robert R. Prechter Jr., Elliott Wave International (EWI) is the world's largest market forecasting firm. Its staff of full-time analysts provides 24-hour-a-day market analysis to institutional and private investors around the world.
© 2005-2022 http://www.MarketOracle.co.uk - The Market Oracle is a FREE Daily Financial Markets Analysis & Forecasting online publication.