


Stock Market Resistance & Cycles Asserting Themselves
Stock-Markets / Stock Markets 2014 Jan 06, 2014 - 03:25 PM GMTBy: Andre_Gratian

 Current Position of the Market
SPX: Very Long-term trend - The very-long-term cycles are in their down phases, and if they make their lows when expected (after this bull market is over), there will be another steep decline into late 2014. However, the severe correction of 2007-2009 may have curtailed the full downward pressure potential of the 40-yr and 120-yr cycles.
Intermediate trend - An important top formation is in the making.
Analysis of the short-term trend is done on a daily basis with the help of hourly charts. It is an important adjunct to the analysis of daily and weekly charts which discusses the course of longer market trends.
RESISTANCE & CYCLES ASSERTING THEMSELVES
Market Overview
By declining on the first trading day of the New Year, the market may be giving us a preview of what lies ahead for the rest of the year. Had it not been for the Fed's intent of keeping interest rates artificially low, I am certain that the influence of the major cycles due at the end of 2014 would have been felt much sooner. But they cannot be denied forever and this is the year when they should assert themselves. There is little doubt in my mind that this year will be markedly different than last.
The market has been resisting even the short-term cyclic influence which calls for a low in February but, finally, the overbought condition, the overhead resistance, the near-term cyclical configuration, and the completion of important price projections will all conspire to bring about the first correction of the year. The 21-point decline in the SPX is most likely only a prelude to a deeper correction that will take place over the next few weeks. And, there are still higher projections into the 1850-1860 range which could play out before we start down in earnest. Most tops form as a result of a distribution period during which sellers overcome the last bulls. This has begun, and could continue for a few more days before our first short-term downtrend. We'll wait and see how much damage it does to the bull market, and if we can expect still higher prices afterward or the beginning of a downward trend which could continue throughout most of the year!
Of all the red flags being raised, sentiment is probably raising the reddest one. Bullishness is at an almost unprecedented level and there is a strong feeling that the market can keep on going up for the foreseeable future without a major interruption. History teaches us otherwise and we would be well- served to heed its lesson.
Chart Analysis
In the last letter, I showed the various channels drawn according to intra-day prices. This placed prices well above the bull market channel and touched the long-term channel top. While arbitrary, I believe that using the daily closes instead provides much more accurate channel lines. In the following chart of the daily SPX (courtesy of QCharts) the index stopped its upward progress very near the top of its bullish channel, and the convergence of the various channel lines of different time frames better defines the area where the index should find resistance (and apparently has).
Thursday's decline has turned both momentum oscillators down. This had been preceded by the lower (A/D) oscillator which is always the first to produce a warning. However, all three still remain positive and the MACD has not yet made a bearish cross, so the odds of starting a significant decline from here are not all that good. It is possible, however, that the near-term downtrend has a little more to go which could send all three oscillators into the red zone. Any last up-thrust to the higher projection target would undoubtedly cause them to create some negative divergence and put the final touch on the anticipated short-term top.
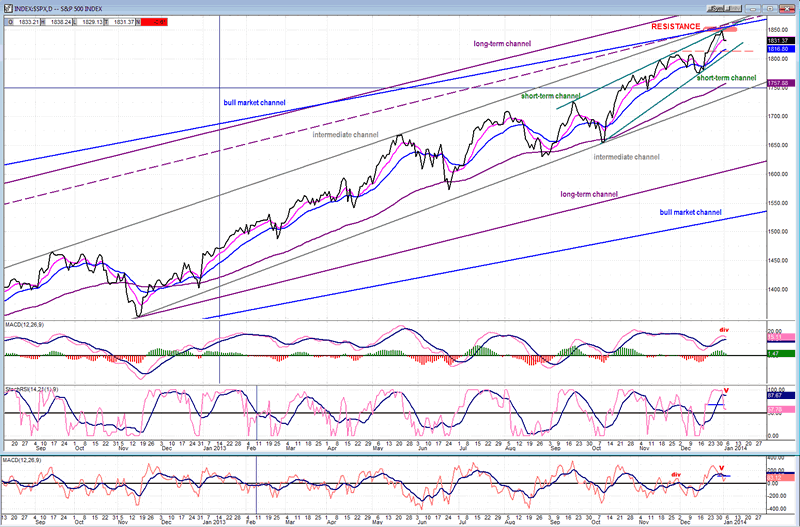
Confirmation that a downtrend has started will come when the SPX breaks out of its short-term channel and, when it does, it should find support in the vicinity of the lower intermediate channel line.
The identification of the various channels are not only useful for pointing out resistance and support levels, but they will also serve as a downward path for the expected major decline which should proceed in a stair-step fashion, finding support on, and then breaking below, each successive channel line, and eventually ending outside of the bull market channel entirely.
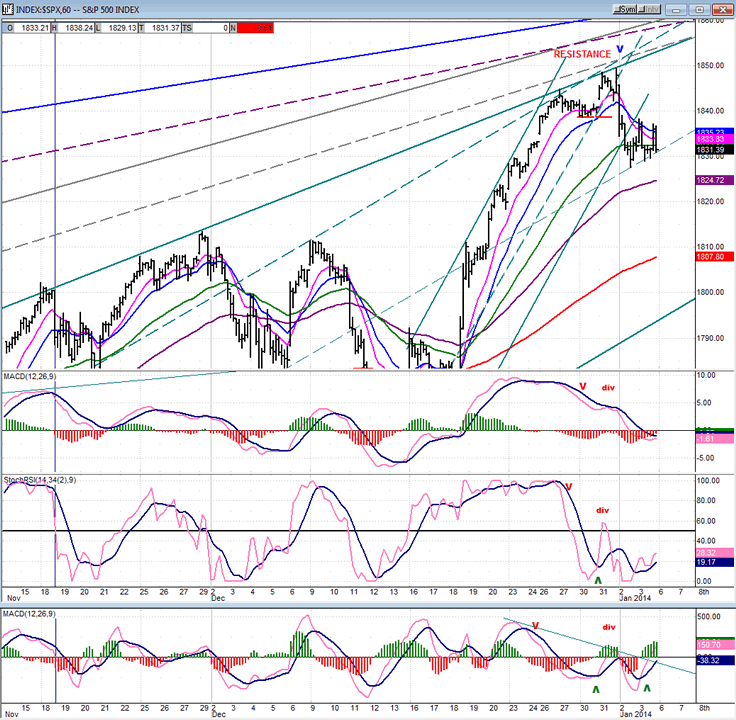
The hourly chart, which comes next, tells us that the decline which started on Thursday may have ended at the 1828 level, but if it has not, the next support level is in the area of the (red) 200-hr MA. It would also give us a perfect 50% retracement of the uptrend which started at 1778.
Monday will give us an early warning of whether the downtrend continues, or if the final leg of the uptrend resumes from 1828. The oscillators have already started to stabilize but as long as they do not give a decisive buy signal, the downtrend is at risk of still being in progress.
Structurally, there are several possibilities which all require additional data to reveal the correct pattern that price is making.
Cycles
The next important cycle to affect the market is a short-term dominant cycle should be topping over the next few days and is scheduled to bottom in mid-to-late February. But this should only be a mild decline compared to what we can expect in the second half of the year when the major cycles make their lows.
Breadth
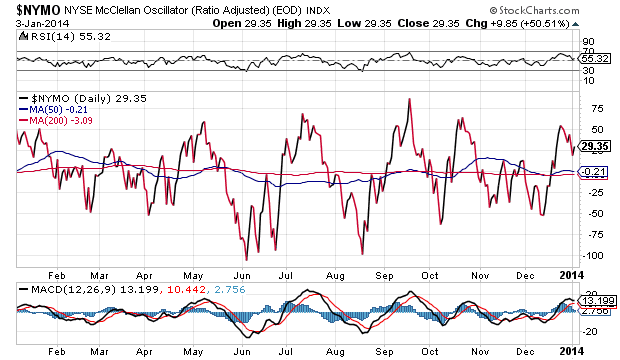
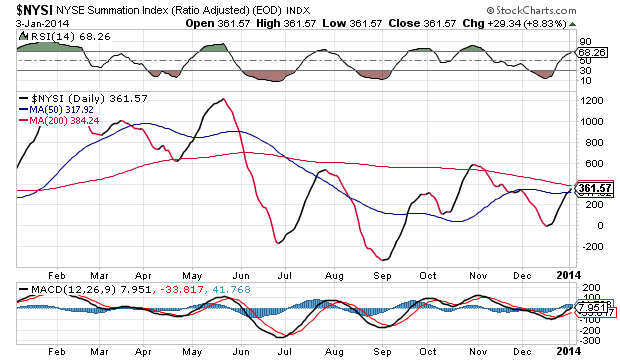
The McClellan Oscillator and Summation Index (courtesy of StockCharts.com) appear below.
Similarly to my own A/D oscillator, the McClellan oscillator has turned down but is still positive, which only indicates mild weakness and, until it worsens substantially, probably keeps the odds in favor of another attempt at making a new high before a genuine short-term correction starts.
The same probability is signaled by the NYSI which is still rising, along with its RSI which normally moves a little higher and shows an overbought condition before signaling a short-term market top. Note, however, that the Summation index is making a lower high, not only with respect to its high mark in May, but also relative to its November peak. This is double negative divergence on an intermediate time frame which should serve as a warning of the approach of an important market top.
Sentiment Indicators
Readings from the SentimenTrader (courtesy of same) are now showing two consecutive weeks of 70, the highest level reached by this index in the past two years.
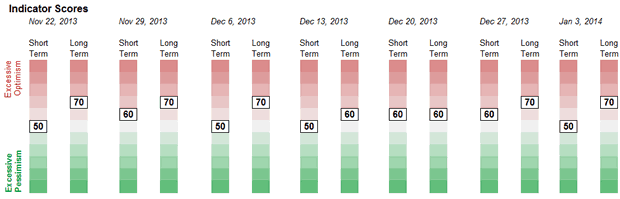
These are recent statistics quoted by the SentimenTrader. They speak for themselves about the current market condition!
Jan 2, 2014: "Traders that are the most consistently useful as contrary indicators have pushed their optimism to an extreme rarely seen in 27 years."
Dec. 30, 2013: "Mutual fund traders in the Rydex family of funds have gone parabolic in their expectations of continually rising index prices."
VIX
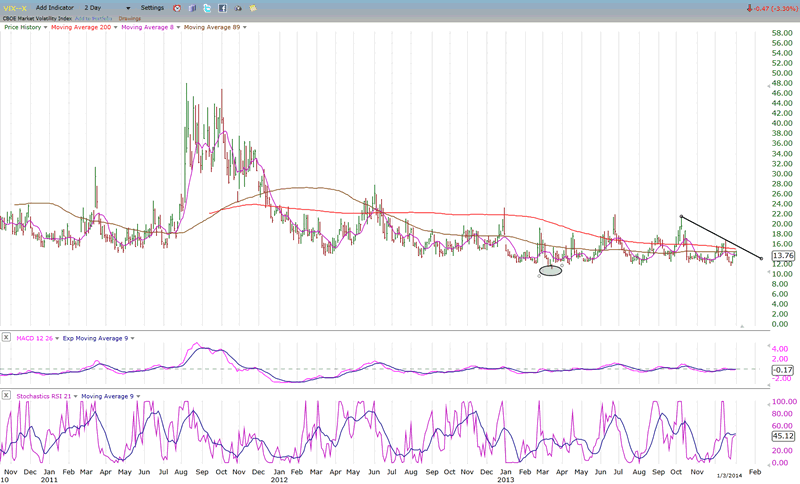
VIX quickly rebounded from its recent low of 11.69, reaching 14.59 in just three days. If the market continues to correct, it should next overcome its short-term downtrend line, and the decline into February should take it beyond its former recent high. It is important to note that VIX has now formed a P&F base (probably still not complete) which indicates a possible surge into the 30s on its next move. The ellipse marks the low point that was made in March 2013.
IWM (ETF for Russell 2000)
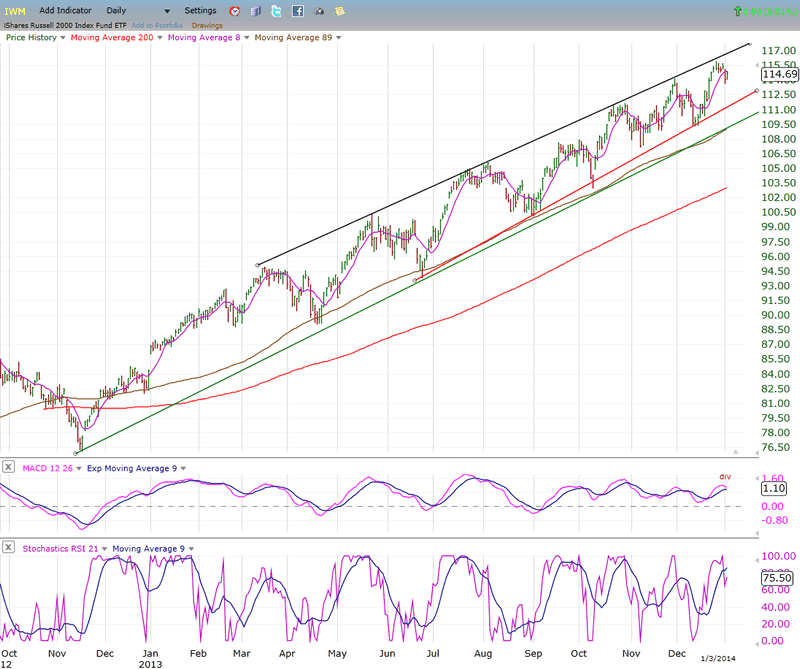
IWM is making a long wedge pattern which reflects gradual deceleration but does not contrast greatly with SPX over the short-term. This could be another indication that we are not yet at a major top. If history repeats itself, before we get to a serious high, IWM should start diverging more noticeably from SPX.
BONDS
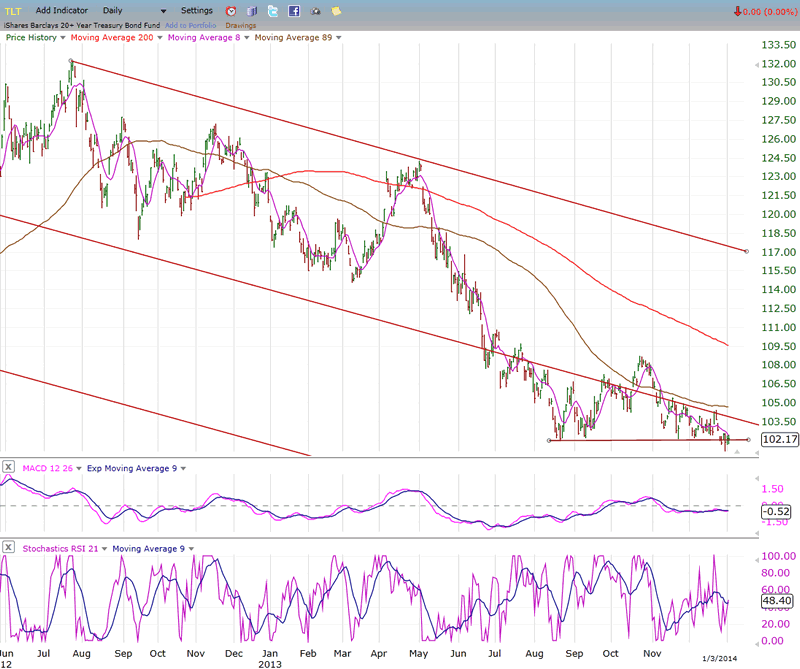
Can't really tell if TLT wants to go lower or hold the current level. Although it has broken slightly below, it has not accelerated to the downside. It needs to be given a little more time to define its intentions.
GLD (ETF for gold)
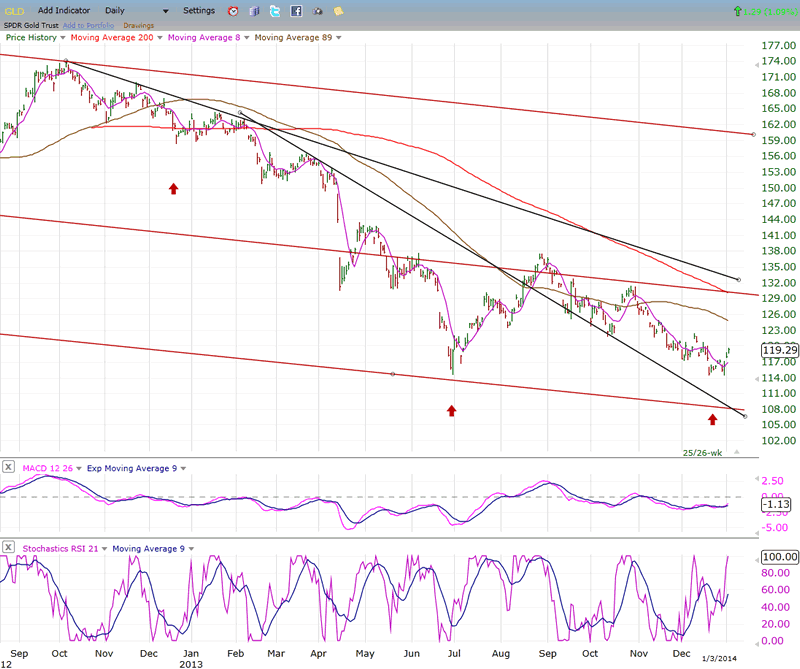
GLD is beginning to show the effect that the now rising 25/26-wk cycle is having on its price. It has already gained nearly 5 points -- enough to have broken above a short-term trend line. If the cycle has as much of an effect on its price as the last time, it is good for several more points on the upside. The P&F base is not well defined, but a 10% move off the low is a good possibility.
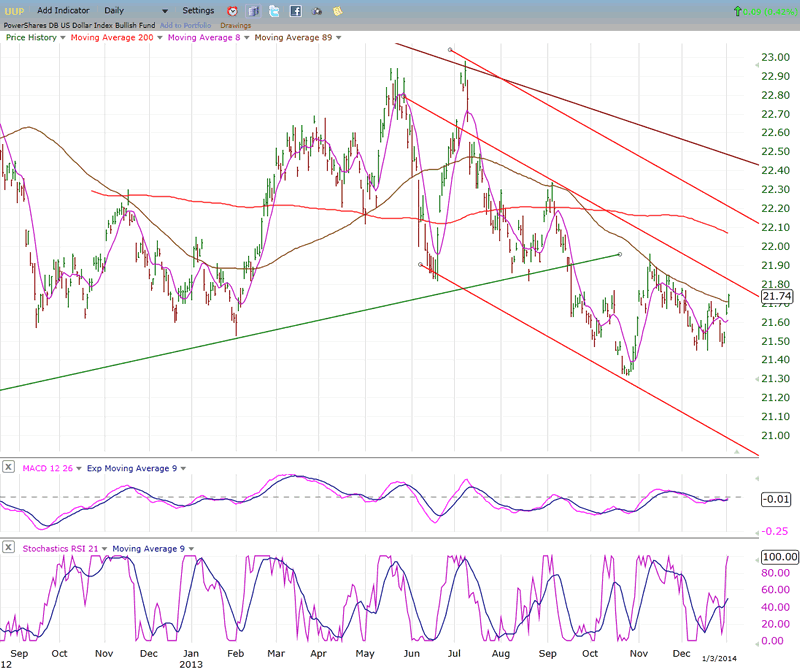
UUP (dollar ETF)
UUP is showing some signs of renewed strength and may be attempting to move out of the lower portion of its red channel. The pull-back has stayed well away from the bottom trend line, and the result has been a higher low. Both indicators seem poised for higher prices. The P&F base has enough of a count to take it well out of its intermediate (red) channel -- a move which seems to be at odds with a rise in the price of gold.
USO (United States Oil Fund)
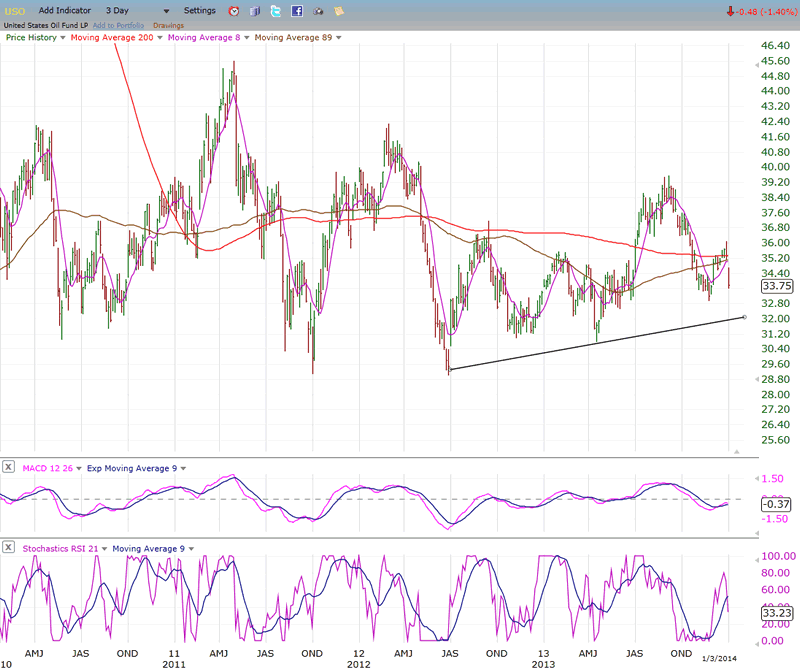
Following the lead from crude, USO has lost almost all of its gain of the past two weeks. If WTIC (94.25) breaks below its former low of 92, USO could easily come down to about the 28 level.
Summary
SPX appears to be in the process of creating a top in preparation for a decline into the February cycle lows. A move beyond the current 1849 high is still possible before this occurs.
The long term cycles which are bottoming toward the end of this year are a threat to the bull market which, under the increasing pressure they bring to bear, is at risk of ending sooner rather than later.
FREE TRIAL SUBSCRIPTON
If precision in market timing for all time framesis something that you find important, you should
Consider taking a trial subscription to my service. It is free, and you will have four weeks to evaluate its worth. It embodies many years of research with the eventual goal of understanding as perfectly as possible how the market functions. I believe that I have achieved this goal.
For a FREE 4-week trial, Send an email to: ajg@cybertrails.com
For further subscription options, payment plans, and for important general information, I encourage
you to visit my website at www.marketurningpoints.com. It contains summaries of my background, my
investment and trading strategies, and my unique method of intra-day communication with
subscribers. I have also started an archive of former newsletters so that you can not only evaluate past performance, but also be aware of the increasing accuracy of forecasts.
Disclaimer - The above comments about the financial markets are based purely on what I consider to be sound technical analysis principles uncompromised by fundamental considerations. They represent my own opinion and are not meant to be construed as trading or investment advice, but are offered as an analytical point of view which might be of interest to those who follow stock market cycles and technical analysis.
Andre Gratian Archive |
© 2005-2022 http://www.MarketOracle.co.uk - The Market Oracle is a FREE Daily Financial Markets Analysis & Forecasting online publication.