


Gold Then and Now
Commodities / Gold and Silver 2014 Jan 03, 2014 - 09:00 PM GMTBy: Tony_Caldaro

 As the saying goes; “History often repeats, but is never exactly the same.” The same can be said for asset classes, if one understands their long term cycles. Let’s examine Gold.
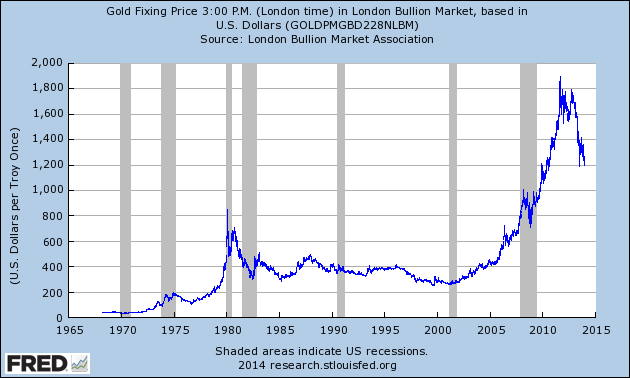
From 1970-1980 Gold entered its first real bull market, in USD terms, rising from $35 to $873. It then entered a 21 year bear market bottoming at $256 in 2001. Both the bull and bear markets left behind certain characteristics. From 2001-2011 Gold had its second bull market, rising from $256 to $1924. In percentage terms it was not as great as the first. But in USD terms it was nearly twice as large.
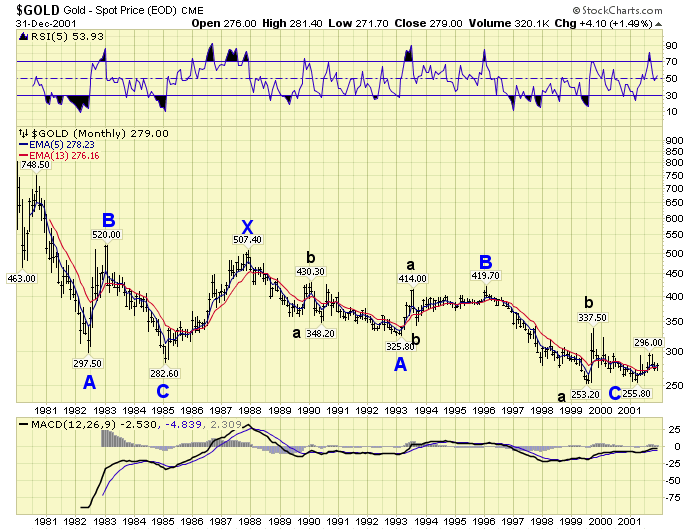
After analyzing the 21 year bear market, 1980-2001, in OEW terms. We determined its bear market pattern. It was basically a double three, abc-x-abc, with the second abc taking up most of the time. The first abc was only five years in duration: 1980-1985. Notice, however, the two best bear market rallies were the first B wave and the X wave. They both retraced about 38.2% of the associated previous decline.
Normally we do not attempt to trade in bear markets. They sometimes can become like bottomless pits. Many of the Gold bulls are probably feeling that way now. However, we did find something quite striking when reviewing the first A wave of the previous bear market: 1980-1982; and the current A wave of this bear market: 2011-2013.
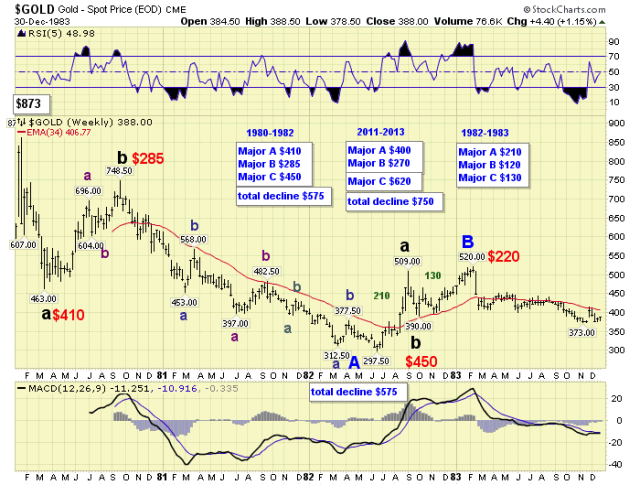
During 1980-1982, Primary A took 29 months, and declined in basically three Major waves: $463-$749-$298. Currently, Primary A has taken 27 months, and has declined in basically three Major waves: $1524-$1798-$1179 thus far. On the surface it does not appear to be much, except the time factor is quite similar. But let’s put the declines side by side.
1980-1982: Major A $410, Major B $285 and Major C $450, for a total decline of $575.
2011-2013: Major A $400, Major B $270 and Major C $670, for a total decline of $750.
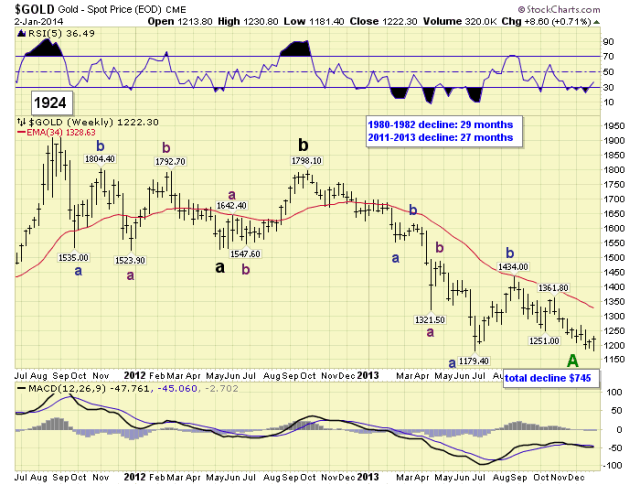
Notice both Primary A waves are quite similar, in time and price. Our Primary A wave count suggests Gold may have recently bottomed in December. We have a completed Major A @ $1524, a completed Major B @ $1798, and potentially a completed Major C @ $1181 at the December low. Should this be correct we could now witness a 38.2% retracement of the entire first decline, ($1924-$1179), into the $1460 area over the next 3-8 months. This would represent a $280 rise. Which is also similar to the $220+ rises of Primary B and Primary X during the last bear market. “History often repeats, but is never exactly the same.”
You can follow Gold along with us using this link: http://stockcharts.com/public/1269446/tenpp/10. Have a healthy and prosperous New Year!
CHARTS: http://stockcharts.com/public/1269446/tenpp
http://caldaroew.spaces.live.com
After about 40 years of investing in the markets one learns that the markets are constantly changing, not only in price, but in what drives the markets. In the 1960s, the Nifty Fifty were the leaders of the stock market. In the 1970s, stock selection using Technical Analysis was important, as the market stayed with a trading range for the entire decade. In the 1980s, the market finally broke out of it doldrums, as the DOW broke through 1100 in 1982, and launched the greatest bull market on record.
Sharing is an important aspect of a life. Over 100 people have joined our group, from all walks of life, covering twenty three countries across the globe. It's been the most fun I have ever had in the market. Sharing uncommon knowledge, with investors. In hope of aiding them in finding their financial independence.
Copyright © 2013 Tony Caldaro - All Rights Reserved Disclaimer: The above is a matter of opinion provided for general information purposes only and is not intended as investment advice. Information and analysis above are derived from sources and utilising methods believed to be reliable, but we cannot accept responsibility for any losses you may incur as a result of this analysis. Individuals should consult with their personal financial advisors.
Tony Caldaro Archive |
© 2005-2022 http://www.MarketOracle.co.uk - The Market Oracle is a FREE Daily Financial Markets Analysis & Forecasting online publication.