Gold Price Has Bottomed.. A Good Possibility...
Commodities / Gold and Silver 2014 Jan 02, 2014 - 11:03 AM GMTBy: Thomas_Clayton
 No nightly raid so far tonight Wednesday Jan first.
MACD line have surpassed ZERO which denotes Uptrend, Stoch RSI & Slow Stoch are Consolidating and the On Balance Volume is more than Positive
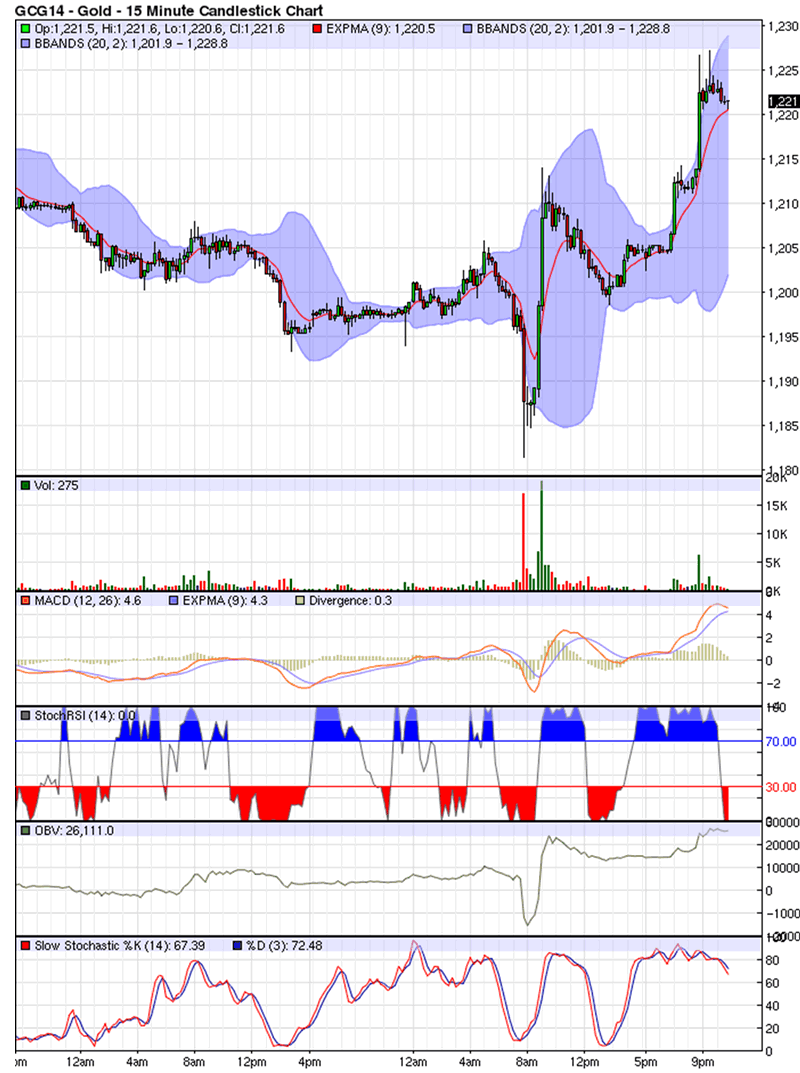
At stockcharts.com, Public Chart List, Easy $$, no 11, Clayton Tom .. Green Arrows are Triiger points denoting Buy. Notice when the MACD lines, cross Zero there is a SURGE in the Price. I USE THIS AS THE MASTER INDICATOR
Go to Pages 15 thru 21 plus to get Gold Silve and Gold Silver related ETFs in variable time frames.
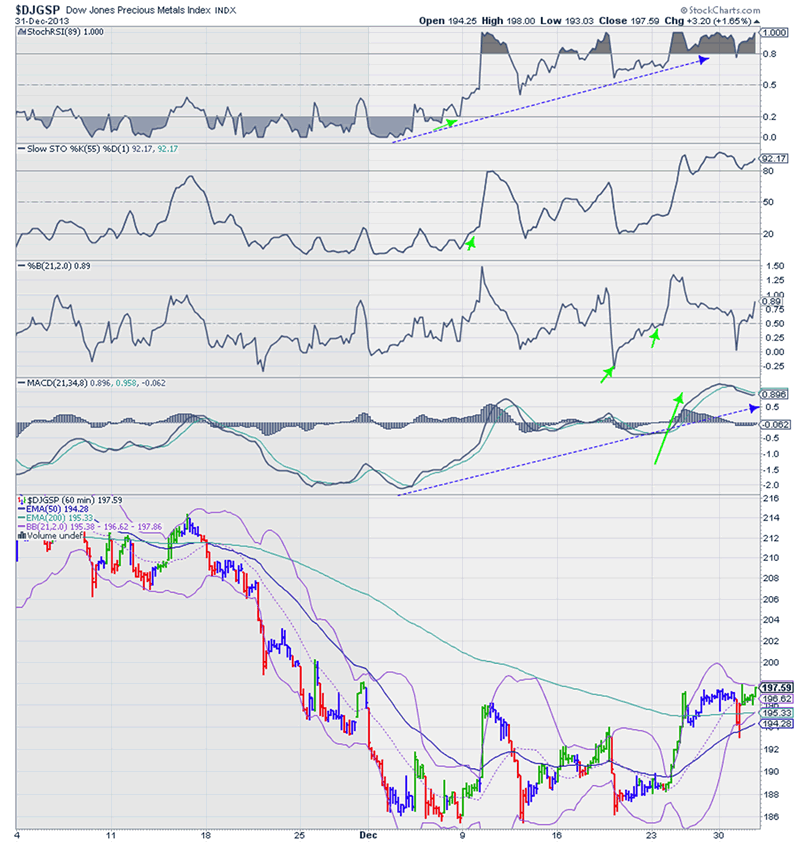
Pg. 15, DOW JONES PRECIOUS METAL, $DJGSP, 1 HOUR. CONFIRMED BUY ON DEC 22nd
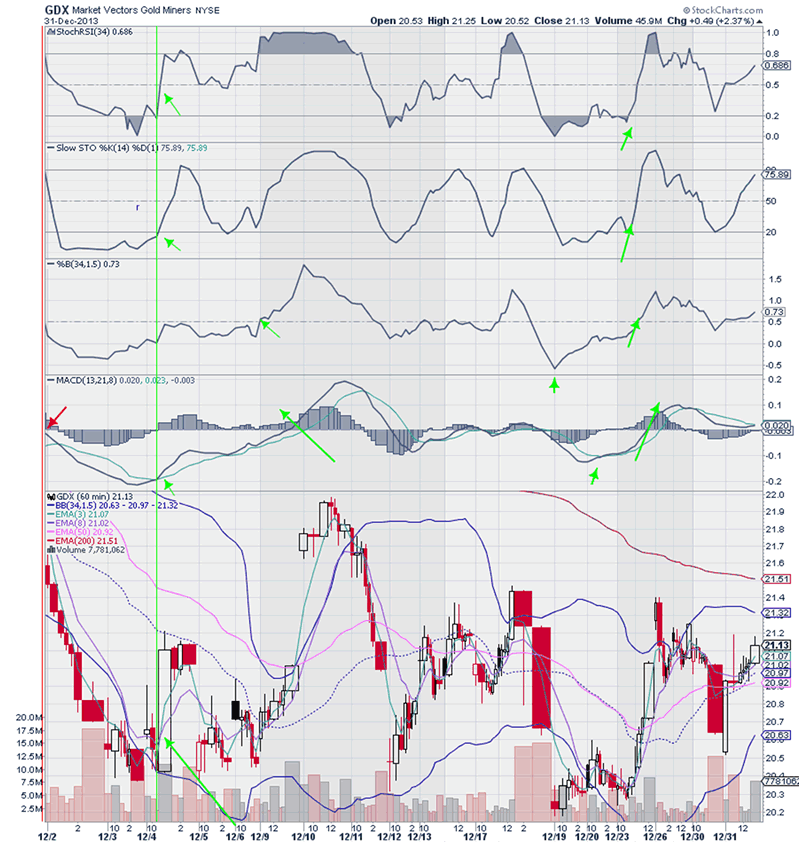
Pg 21, GDX, Gold Miners ETF 1 hour Volume Candles, Notice the huge Red Candles, Capitulation, huge Sellers means there is huge Buyer on the other side of the trade. Again follow Green Arrows for trigger points After MACD lines cross upwards, the Line Cross Above Zero and usually a Surge in Price. Anticipate this for your Entry Point GDX is the tail which Expresses NUGT x3 on Up moves and DUST x3 on Down moves. Next chart down.
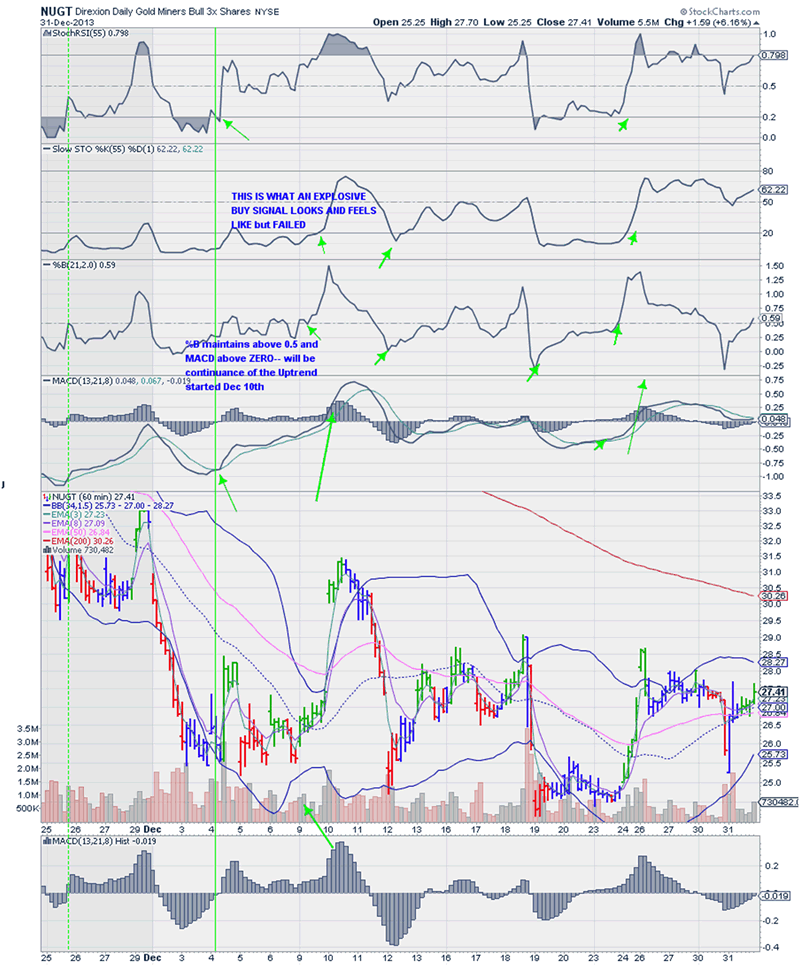
Page 15 NUGT, 1 hour , Again observe the Green Arrows denoting Buy Signal on the respective Indicators.
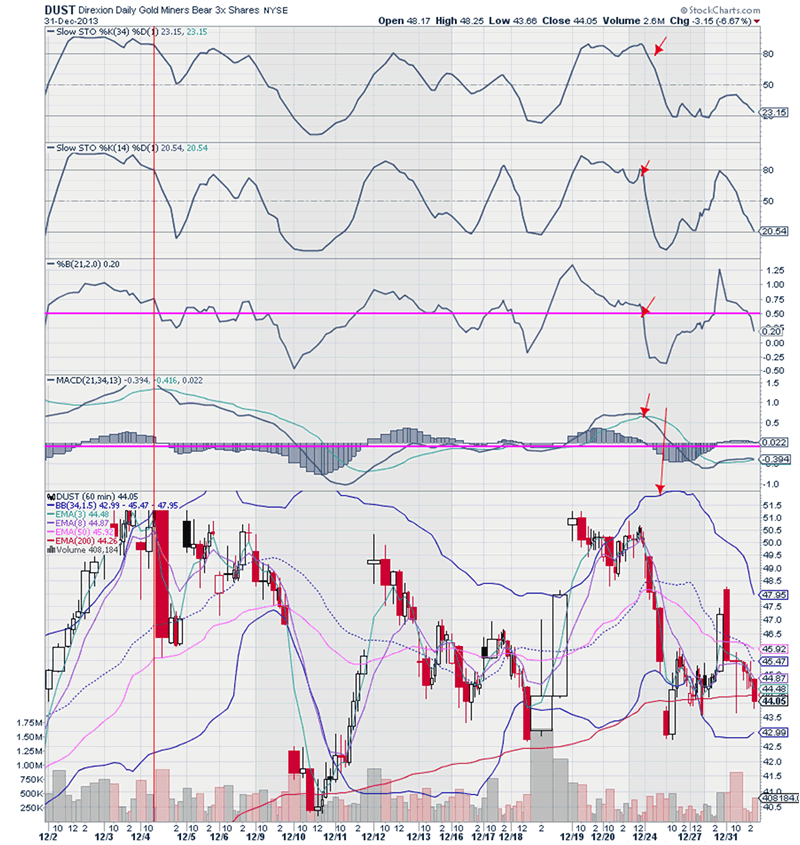
Page 19 DUST, Bear GDX Gold Miners x 3. Observe the Red Arrows for Sell Triggers. If GDX expresses a Sell, then of course you want to be Long DUST .. and GDX Buy, be long NUGT.. these are the most Volatile ETFs in Existence. Caveat, a Double Edged Sword. Be in the correct ETF in the right Direction- USE STOPS.
MACD LINES ARE ABOVE ZERO WHICH DENOTES IN UPTREND SINCE 8a.m. Dec 31.
Stochastic RSI & Slow Stoch are consolidating after this spike On Balance Volume UP.
I am a retired pharmacist, but went through the Dean Witter training Program, as depicted in the movie "Seeking Happyness" with Will Smith, and worked as a Representative with stocks and commodities for D. Witter, which was later absorbed into Morgan Stanley.. I do this as an avocation now. It would have been nice to have had access to this Technical Analysis as offered at stockcharts.com back in the early 1970s. You may see my work at stockcharts.com, public chart list, Easy $$, Clayton Tom. Thank you for your interest.
By Thomas Clayton
© 2013 Copyright Thomas Clayton - All Rights Reserved
Disclaimer: The above is a matter of opinion provided for general information purposes only and is not intended as investment advice. Information and analysis above are derived from sources and utilising methods believed to be reliable, but we cannot accept responsibility for any losses you may incur as a result of this analysis. Individuals should consult with their personal financial advisors.
© 2005-2022 http://www.MarketOracle.co.uk - The Market Oracle is a FREE Daily Financial Markets Analysis & Forecasting online publication.


