Silver Price Forecast to Hit New Highs As Quality Of Analysis Falls To New Lows
Commodities / Gold and Silver 2014 Dec 31, 2013 - 11:27 AM GMTBy: Steve_St_Angelo
 The coming explosion in the value of silver will be a shock to the world due to the failure of the analyst community. I am completely amazed at the lack of quality analysis today. Except for a few good analysts, there's a sea of lousy ones who continue to put out work that becomes increasingly worthless each and every passing day.
While we can totally write-off most of the forecasting that comes from the MSM - Main Stream Media, I am quite surprised at the amount of garbage coming from the alternative media. I don't mean to be blunt here, but sometimes it's best to be honest.
I get a great deal of email from readers who forward articles that run contrary to my analysis and forecasts. They do so because they are concerned of the possibly that there might be a kink in my analysis. What they are looking for are answers and confirmation in their beliefs and investments. I actually do the same thing myself.
I believe, if the best high-quality work is put forth, the answer is plain to see by the investing public. Unfortunately when the majority of analysis in the market is faulty... so are the majority of investments.
Part of the problem with the analyst community today is that their paycheck forces them to put out work that goes along with the consensus view. And... the consensus view is to continue the largest financial Ponzi Scheme in history. Thus, any analyst who works for the establishment must never think outside the box as the box is from where he receives his salary.
This also seems to be true for many in the Alternative Media. Either the alternative analyst goes along with the company's overall message in which he or she is employed, or utilizes data and information in forecasts that is superficial or worthless. Both are lose-lose propositions.
For example, there seems to be a great deal of hype on the "New Shale Energy Revolution" supposedly taking place here in the United States. While the shale industry has brought on more oil and gas production in the states, it is not a new revolution, but rather the final stage of an industry heading for retirement.
I gather many of these analysts and websites pushing this new U.S. Energy Revolution mantra are trying to be part of the "IN TREND." This is indeed the curse of the analyst community -- riding the fumes of a trend that will collapse as the fundamentals kick in.
The Silver-Energy Connection
As I have written and spoken many times before, gold & silver are a store of value because they are a store of ECONOMIC ENERGY. When I first came up with this theory, I used the term "Store of Energy Value." However, Mike Maloney in his excellent series, "Hidden Secrets of Money" used the term Economic Energy to describe how gold and silver store this value. I now use that term all the time.
Another problem with the alternative analyst community is that they tend to over-specialize and not see what is taking place in other industries. That being said, lets look at the chart below which shows the extreme volatility in oil prices during the 1960's decade:
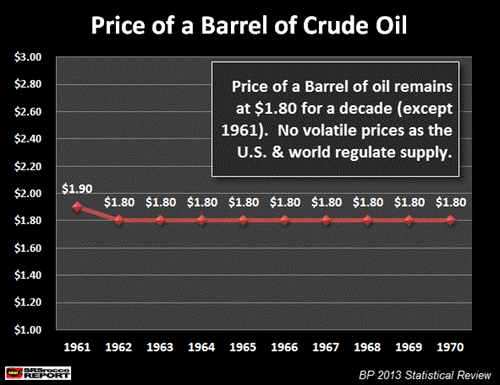
As we can see the price of oil dropped from $1.90 a barrel in 1961 to $1.80 for the remainder of the decade. That 10 cent drop was the extent of the volatility in the oil price as the U.S. and world regulated supply to keep prices at a contracted $1.80 for an entire decade.
Of course nothing stays the same, so after the U.S. peaked in oil production in 1970 along with the Arab Oil Embargo in 1973, the world would never again enjoy regulated low oil prices as it did in the 1960's.
This next chart shows how supply-demand forces, politics and inflation impacted the price of oil in the following decade:
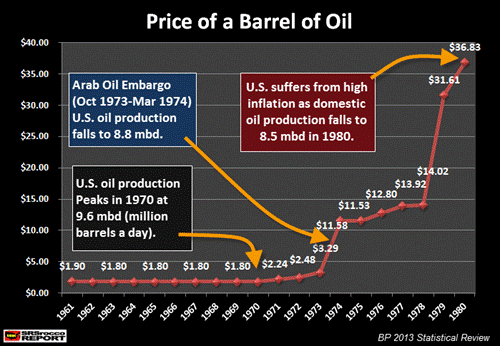
Several factors pushed the price of oil from $1.80 a barrel in 1970 to $36.83 by 1980. As I mentioned, the U.S. peaked in oil production in 1970 at 9.6 mbd (million barrels a day) -- the last year the price remained at $1.80 a barrel.
In 1973 the Arab Oil Embargo pushed up the price of oil to $3.29. Then by the following year, as U.S. oil production fell to 8.8 mbd and the full impact of the oil embargo was realized, the price of oil more than tripled to $11.58.
In addition, as monetary inflation kicked in the latter part of the decade and as U.S. oil production continued to decline (to 8.5 mbd), the price of oil hit a new record of $36.83 in 1980. This is a factor many who analyze precious metals by technical analysis, fail to comprehend.
I was sent a technical trend report from Eidetic Research by one of my readers. In the report was this long-term silver chart.
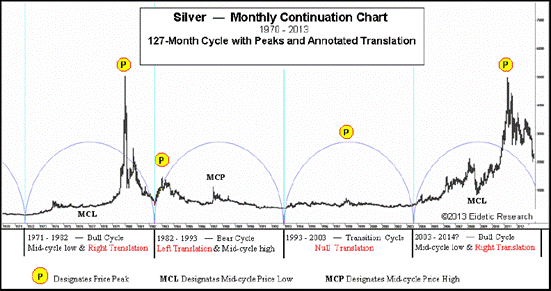
Basically, the chart is showing the long-term 127 month cycle for silver. We can see the different cycles -- bull, bear and transition. From this chart, the folks at Eidetic Research are trying to give a future forecast on where silver is heading.
I believe this sort of analysis is a waste of time because they are forecasting in an energy vacuum -- predicting the future price of silver void of future energy factors. These cycles may have worked when the world was continuing to grow its oil production, but will fail miserably when energy comes in short supply.
I am not singling out Eidetic Research as most of the precious metal community still adhere to the worthless religion of technical analysis. On a positive note, the folks at Eidetic Research believe the future price rise in silver will be due to the debasement of fiat currency and not the supply & demand forces. I totally agree.
The reason why the price of silver increased substantially in the 1970's decade, was not due to technical analysis, but rather the fundamental exponential rise in the price of oil... shown in the chart above.
You will notice that the price of silver paralleled the increase of the price of oil:
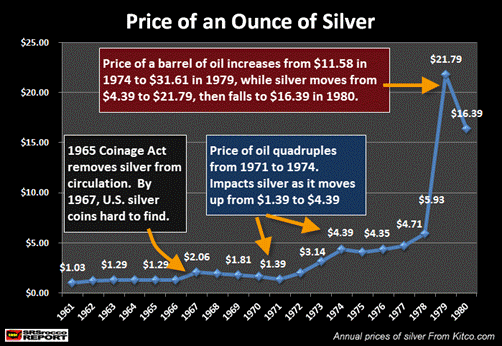
From 1961 to 1970, the price of silver remained virtually flat as did the price of oil. The only reason why we had the move up to $2.06 in 1967 was due to the impact of the 1965 Coinage Act which removed silver from circulation.
When the price of oil went from $2.24 in 1971 to $11.58 in 1974, silver moved up from $1.39 to $4.39 respectively. This is when the Hunts started buying silver. Between 1970-1973, the Hunts purchased 200,000 oz of silver.
Then from 1974 to 1978, the price of oil only increased modestly from $11.58 to $14.02. We find the same movement in the price of silver as it increased from $4.39 in 1974 to $5.98 in 1978. This was at the same time the Hunts purchased over 75+ million ounces of silver.
There is a silly notion that the Hunts were trying to corner the silver market... they weren't. They were trying to protect their oil profits from their Libyan Oil Fields as inflation was increasing rapidly in the United States.
In just one year, the price of oil shot up from $14.02 in 1978 to $31.61 in 1979. This is the same year that the price of silver skyrocketed from $5.93 (1978) to $21.79 (1979). Please note all these figures are in average prices for the year.
Even though the price of silver (300%) performed much better than oil (125%) from 1978-1979, when we consider the change since 1971, they were about equal.
Silver & Oil Increase 1971-1979
Oil = 1,300% increase
Silver = 1,450% increase
So, the idea that the big move in the price of silver was solely due to the Hunt's trying to corner the market fails to consider the impact of the price of energy on the shiny metal. Jim Sinclair mentioned in one of his interviews that while the Hunts were buying a lot of silver, there were huge institutions right behind them doing the very same thing.
We also can't forget, as the price of oil moves higher, so does the cost to mine silver. Another assumption made by the precious metal community is that the miners were making a killing during the big move up in gold and silver during the latter part of 1970's. This is erroneous once we realize costs were moving up significantly as well.
I have obtained old Annual Reports from Homestake Mining, and I can tell you point-blank.... their financial results were much better in 1973-74 than they were in 1978-1979.
Homestake Operating Earnings to Revenues
1973 = 16.3%
1974 = 31.3%
1978 = 12.4%
1979 = 24.4%
The one thing that Homestake was quite successful in doing compared to the present gold mining companies, is the huge payout of cash dividends to shareholders. In 1979, Homestake paid $22.6 million in cash dividends... a whopping $2.00 a share.
Here are the dividend payouts by the top 5 Gold Miners during the record price of gold in 2011:
Barrick = $0.51
Newmont = $1.00
Anglo Gold = $0.34
GoldCorp = $0.41
Kinross = $0.11
Newmont paid the most to its shareholders at $1.00 a share, but this was still half of what the Homestake shareholders received in 1979 at $2.00 a share. This may not seem like much of a difference until we factor in the ravages of inflation over the past 32 years.
If we go to John Willams Shadowstats.com and input a $1 worth of dividends in 1979, it turns out to be worth $2.94 in 2011 Dollars... let's just make it a round 3 bucks. So, the Homestake shareholders would actually be getting $6 a share in 2011 Dollars. Thus, inflation makes the gold mining dividends paid today seem quite insignificant.
I decided to reduce all the gold miners 2011 dividends in the example above to a third, to equal the same value in inflation terms to the $2.00 a share in dividends Homestake paid out in 1979:
These are the TRUE DIVIDEND values if we adjust for inflation to equal the $2.00 a share dividends paid to Homestake shareholders in 1979:
Barrick = $0.17
Newmont = $0.33
Anglo Gold = $0.11
GoldCorp = $0.14
Kinross = $0.04
Once we factor 32 years worth of inflation, we can see that the gold miners today are paying a pathetic amount of dividends compared to Homestake Mining in 1979.
One important factor the precious metal analysts fail to understand today is the huge DILUTION of shares over the past several decades that went into growing the gold mining industry at the expense of the shareholder. This was due to the falling EROI of energy as well as the manipulation of gold and silver via the derivatives and financial markets.
Now that we understand the relationship between energy and silver (and gold), let's look at some very interesting Silver-Oil Ratios.
The Vital Silver-Oil Ratio Relationship
Today, fundamentals are thrown out the window so the Greatest Financial Ponzi Scheme in history can continue for a little longer. Analysts who go along with this trend get to keep their jobs. Because I don't have to bend-over for a paycheck from one of these fine brokerage houses or banks, I can provide out-of-the-box analysis free from the threat of the orthodox mindset.
Analysts who forecast where silver is going based on technical analysis such as Elliot Wave, Cycle Theory and Candlestick formations do so in an energy void. They see the price or value of silver based on movements of charts only. Silly analysts.
If we go back and look at some fundamental data on oil and silver, we can see a very interesting trend. This first chart shows how the price of oil and silver are closely tied together.
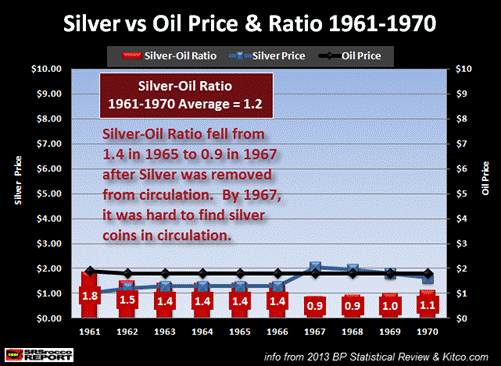
When gold and silver were used as money in the United States, their ratio's to the price of oil were held relatively close. Here we can see that the price of oil and silver remained virtually flat unless we consider the slight blip up in 1967 due to the public hoarding of silver coins after it was removed from circulation via the 1965 Coinage Act.
The Silver-Oil ratio remained at 1.4 for many years until it dropped to 0.9 in 1967 (due to the impact of the public hoarding silver). The Silver-Oil-ratio for this decade averages out to be 1.2. Thus, the Silver-Oil ratio was extremely low when gold and silver were the legal forms of money in the United States.
The next chart reveals the impact of a peaking domestic oil supply, the drop of the gold-dollar peg, the Arab Oil Embargo and inflation on the price of oil and silver during the 1970's decade.
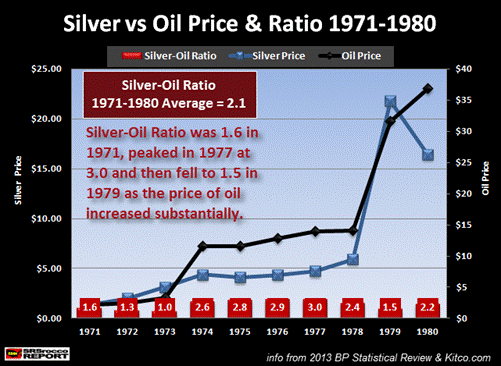
You will notice as the price of oil increased, so did the price of silver. The trends aren't exact, but they moved up in a similar fashion. The Silver-Oil ratio increased from 1.6 in 1971 to 3.0 in 1977, even though the Hunts were buying a great deal of silver supposedly cornering the silver market.
We must remember, the higher the Silver-Oil ratio, the cheaper silver becomes compared to oil. So, for the price of silver to gain in value compared to oil, the ratio will be a lower number.
Here we can see as the price of oil shot up in 1979, so did the price of silver. Many analysts claim that silver was extremely over-bought or highly speculative at this time, but according to my analysis... it was trying to regain its proper relationship to oil as a monetary metal.
Once the Fiat Monetary Masters got involved along with the CFTC, the price of silver was knocked lower in 1980 to average $16.39 even though the price of oil increased to $36.89 from $31.61 in 1979. Furthermore, as the price of silver weakened, the Silver-Oil ratio increased to 2.2 in 1980 up from 1.5 in 1979.
If we take the average for the Silver-Oil ratio in the 1970's it had increased to 2.1 from the 1.2 ratio in the prior decade. Again, the higher the ratio the lower the value of silver to oil.
The Dollar was saved when Fed Chairman Paul Volcker increased interest rates which further destroyed the value of silver compared to oil. For the next two decades the Silver-Oil ratio became extremely volatile.
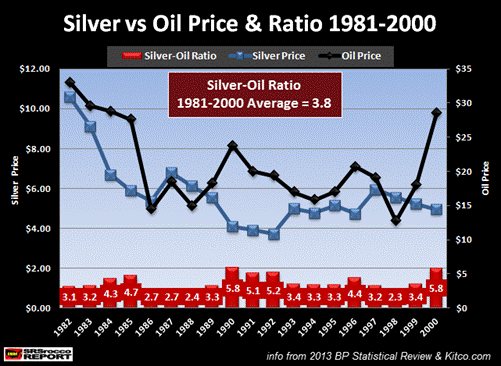
I am not going to get into too much detail during this time period, but we can clearly see the Silver-Oil ratio increased again during these two decades to average 3.8, nearly double the ratio compared to the 1970's decade.
This next chart gives us an idea just how out-of-whack the Silver-Oil ratio has become. Similar to the 1970's decade, the price of oil and silver have risen in tandem during the 2000-2013 time period.
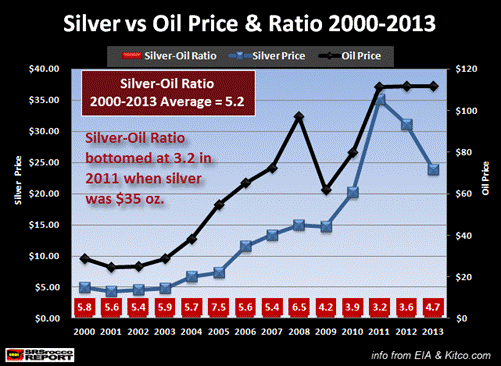
In 2000 the Silver-Oil ratio was 5.8, but fell significantly in 2011 to 3.2 when the price of silver averaged $35. Once again, as silver was getting ready to top $50 in April of 2011, the Comex stepped in and increased silver margins a record 5 times within a very short period of time to bring "Order" back into the market. What they meant to say was, "to bring order back to the weakening fiat Dollar."
Many analysts believe silver was becoming parabolic and extremely over-bought during the first 4 months of 2011. However, if we look at the data going back 5 decades, we can clearly see that silver was trying to reestablish itself as a monetary metal in relation to the price of oil.
Here are the average Silver-Oil ratios for the four time periods:
Silver-Oil Ratios
1961-1970 = 1.2
1971-1980 = 2.1
1980-2000 = 3.8
2000-2013 = 5.2
Ever since gold and silver have been removed from their role as monetary metals, the ratio of Silver to Oil has increased from an average of 1.2 in the 1961-1970 time period to 5.2 during 2000-2013.
Basically, you can buy more than three times the amount of silver compared to oil today than you could during the decade of the 1960's.
The Central Banks and Monetary Authorities have done a fine job bamboozling the public in making sure that gold and silver remain as silly investments only the fringe in society would purchase and hold.
When the price of silver reached $35 an ounce in 2011 it wasn't a parabolic move higher, rather it was behaving more like a balloon being released from far below the surface of the water.
If we were to value silver today compared to its oil ratio during the following periods, this would be the result:
Present Silver Value At Prior Silver-Oil Ratios (based on $111.30 Brent crude oil)
1981-2000 (3.8 ratio) = $29.30
1971-1980 (2.1 ratio) = $52.95
1961-1970 (1.2 ratio) = $92.67
What has taken place with the price of silver is that its value to oil has declined significantly over the past 4 decades while the world has increased its exposure to owning paper assets. Here is a chart that I have used in past articles.
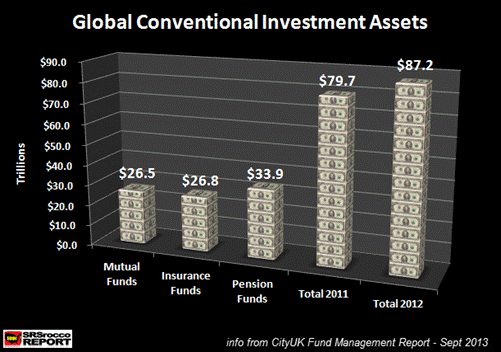
The majority of investors in the world have parked their hard-earned fiat currency into paper assets hoping they will protect their wealth in the future. Unfortunately for these investors, energy is the driver of the global economy... not finance.
So when the world finally realizes that the new supposed "Shale Energy Revolution" is nothing more than another Ponzi Scheme kept alive by ultra low-interest rates, huge amounts of debt and massive drilling to give the illusion of sustainability.... the over $100 Trillion of PAPER GARBAGE called Global Conventional Assets will implode.
When you add-on top of this the coming collapse of fiat currencies, only a NIT-WIT would pay most of their attention to Technical Analysis Waves or Cycles.
Folks, due to the coming Peak of Global Oil Production, the Business Cycle will be over. The world just doesn't know it yet. The value of gold and silver will explode in the future not because I am a Precious Metal Bug who can only can regurgitate a BULLISH RANT, but because the fundamentals and data say so.
The majority of analysis today is completely worthless because most of the analysts have no idea the world has passed them by. They continue to focus on subjects and areas that are completely worthless. The internet is full of analyst's WHITE NOISE which is quite a shame as the public and investors will pay the ultimate price.
I have recently come across new data that makes an even larger degree of analysis seem quite meaningless. I plan on putting out a full report on this in the beginning of the year.
Please check at the SRSrocco Report for I will be publishing the BOMB-SHELL that destroys a great deal of previously held assumptions.
At the SRSrocco Report, we will explore how energy will impact the mining industry in the future. Falling ore grades and decreasing yields are only part of the problem. As net oil exports continue to decline, energy prices will rise putting more pressure on the mining industry. Thus, rising energy costs will guarantee rising prices of gold and silver.
© 2013 Copyright Steve St .Angelo - All Rights Reserved Disclaimer: The above is a matter of opinion provided for general information purposes only and is not intended as investment advice. Information and analysis above are derived from sources and utilising methods believed to be reliable, but we cannot accept responsibility for any losses you may incur as a result of this analysis. Individuals should consult with their personal financial advisors.
© 2005-2022 http://www.MarketOracle.co.uk - The Market Oracle is a FREE Daily Financial Markets Analysis & Forecasting online publication.


